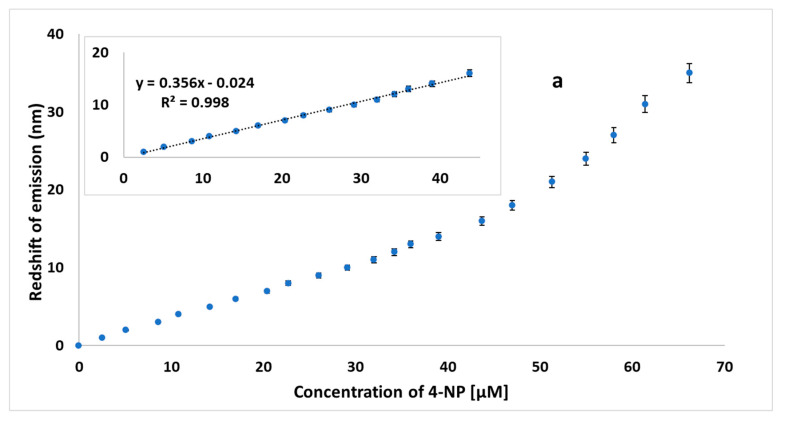
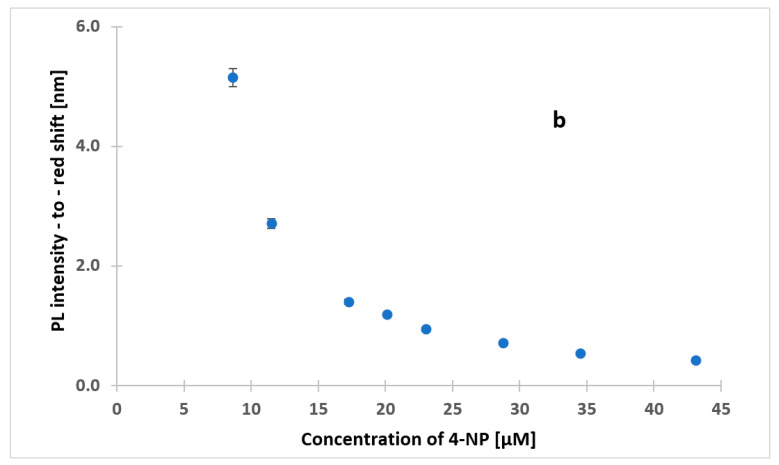
Figure 8.
(a) Zero values of the first derivatives of emission spectra as a function of concentration of 4-NP (μΜ). Inset: linear range at concentrations between 2.5 and 45 μM and (b) ratio of PL intensity-to-emission red shift (nm) at different concentrations of 4-NP, using HL-CNDs (λex = 330 nm). Error bars represent the standard deviation of three replicates.


