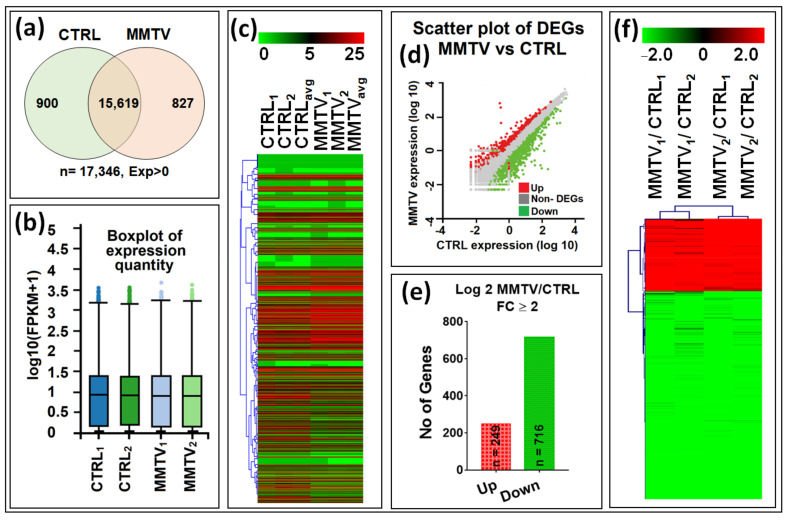
Figure 2.
Summary of the gene expression analysis of the RAW and DEG data. After sequencing, a total number of 17,346 raw transcripts were retrieved. In this study, 2 biological replicates of each group were sequenced, and the average was taken to ensure the similarities within groups. For DEG analysis, cross-sectional comparison was performed for each group. Initially, fully automated Dr. Tom software from BGI was used to analyze the raw data as well as for the differential expression calculations. (a) Venn diagram showing the expression of total (n = 17,346), overlapping (n = 15,619), and unique transcripts (genes) between CTRL (n = 900; green circle) and MMTV (n = 827; pink circle) groups. (b) Tukey box plots showing the comparison among the sample level distribution of gene expression data post normalization for 4 samples. (c) Heatmap of the hierarchal clustered RAW data representing expression profile of 17,346 transcripts in all groups. (d) Scatter plot of DEGs showing the expression profile of DEGs and non-DEGs. Red dots show up-regulated genes, whereas green dots show repressed or down-regulated genes. The remaining (gray) were classified as non-DEGs. (e) Mapping of differentially expressed genes. Up- (red) and down- (green) regulated genes with in each comparison included in this study with fold change (FC) ≥ 2. (f) Heatmap showing the hierarchical clustering patterns of the 965 differentially expressed genes with FC ≥ 2 among all groups.

