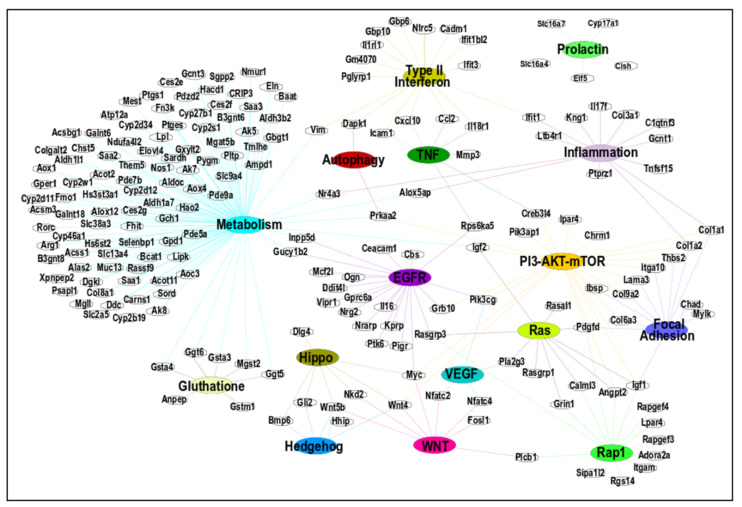
Figure 5.
Networking among differentially expressed genes (DEGs) and pathways identified via GSEA. The top 16 pathways were identified using GSEA. Cytoscape was used to create the network using an organic layout. The network comprised 211 nodes and 258 edges. All genes included in this figure showed significant up- or down-regulated changes (FC > ±2).

