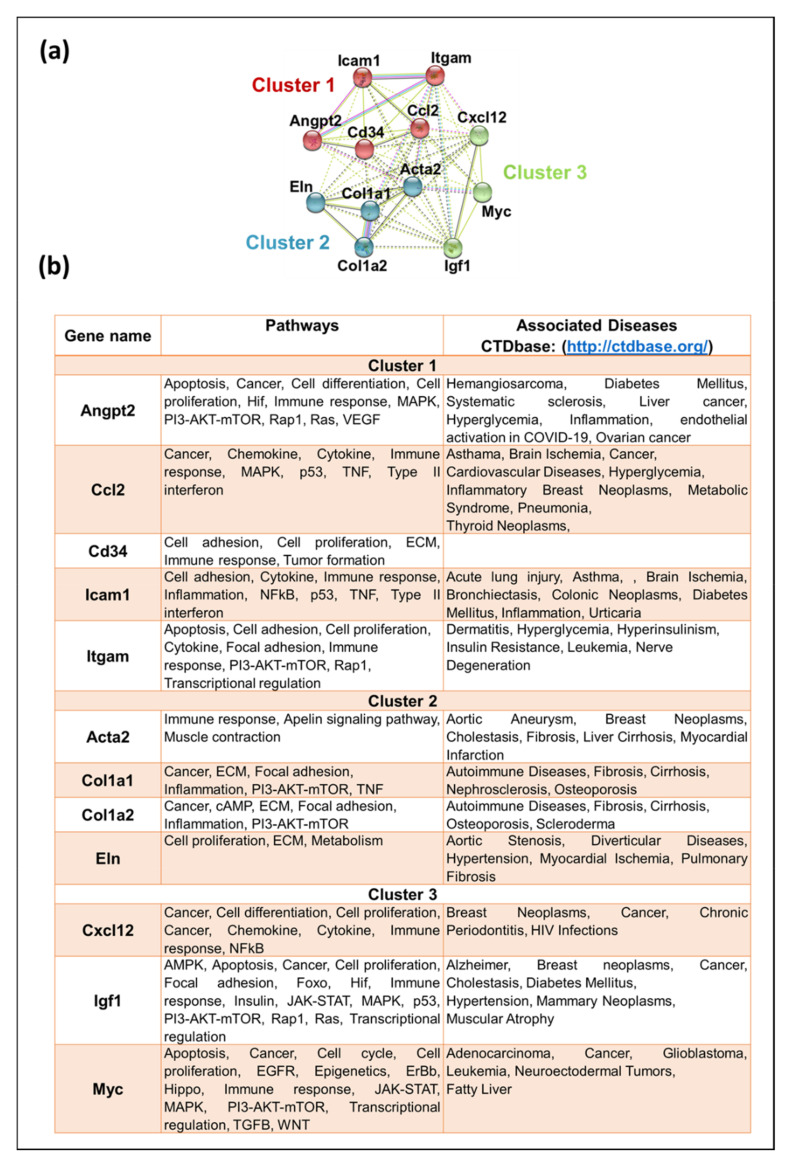
Figure 7.
Functional analysis of key hub genes. (a) STRING was used to draw any functional similarities among key hub genes. K-means clustering using STRING resulted in 3 clusters, represented as red, blue, and green. The solid lines show interaction among the same group, while dotted lines show interaction among different clusters and sub-components. For STRING networks, the turquoise lines show known interactions from curated databases, the pink lines show experimentally determined interactions, and the yellow, black, and light blue lines show text-mining, co-expression, and protein homology interactions, respectively. The green, red, and blue lines show predicted interaction among gene neighborhoods, gene fusions, and gene co-occurrence, respectively. (b) Functional enrichment analysis and association of the key hub genes with known diseases. Genes were searched for the molecular pathways using KEGG, Wiki, and Reactome pathway databases as well as other gene databases. Association of these genes with diseases was searched in CTDbase, with only experiment evidence option.

