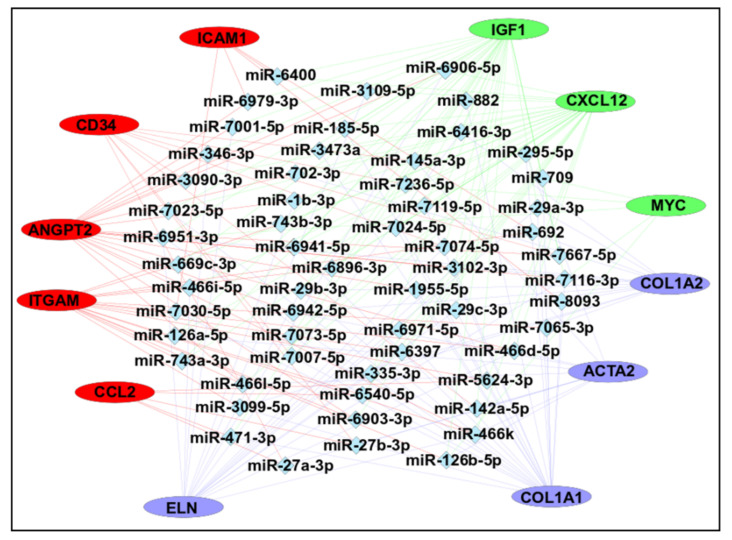
Figure 9.
mRNA-miRNA interaction network. The mRNA–miRNA interaction map was constructed using Cytoscape with 12 hub genes and 58 predicted miRNAs. Every miRNA presented here showed interaction with at least 3 genes. The color of hub genes was selected based on the k-means clustering of the genes using STRING.

