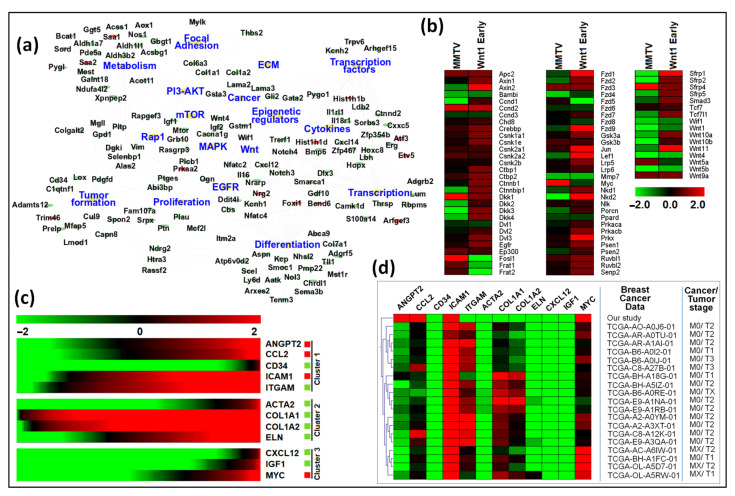
Figure 10.
Gene expression comparison among our study, the PyMT, and Wnt1 tumor models, as well as human breast cancer data. (a) Networking among differentially expressed genes (DEGs) and pathways identified commonly in our study and the study by Cai et al. using PyMT mouse model [87]. The top 17 pathways were identified, sharing at least 5 or more common genes from both studies. Cytoscape was used to create the network using an organic layout. The network comprised 156 nodes and 271 edges. Red and green ellipse shapes represent up- and down-regulated genes with in KEGG pathways, respectively. The orange octagon shapes represent individual pathways. (b) Gene expression analysis between our study and Wnt1 early mouse model. Red and green boxes represent up- or down-regulated genes in both studies, respectively. (c,d) Functional analysis of key hub genes with panel (c) showing expression of key hub genes retrieved from RNAseq expression from profiles of all human breast cancer patients. The expression pattern of 12 hub genes in 10,967 human breast cancer samples was analyzed. (d) Clustering of hub genes and human breast cancer samples from the TCGA database. The expression pattern of the 12 hub genes in 1,084 samples was analyzed with respect to gene expression and tumor stage. The figure shows only the cluster containing our data. Red = up-regulated genes; Green = down-regulated genes.

