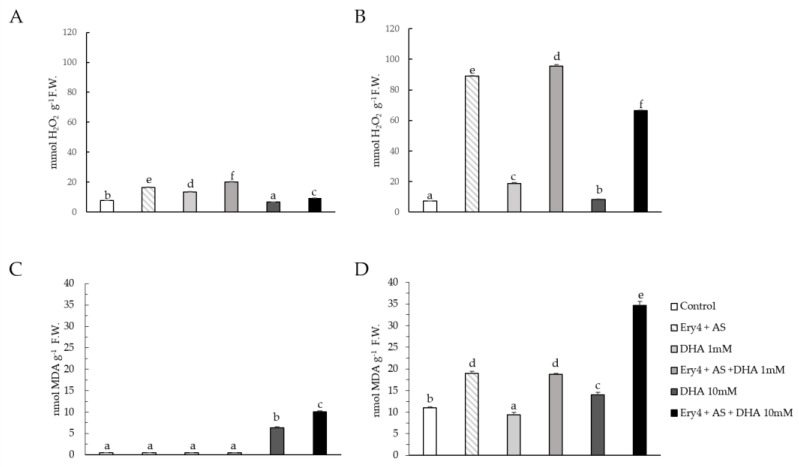
Figure 6.
Hydrogen peroxide (Panel (A), pellet; Panel (B), supernatant) and lipid peroxidation (Panel (C), pellet; Panel (D), supernatant) content of corn samples using Ery4 (5 U/mL) acetosyringone (AS) 10 mM, and dehydroascorbic acid (DHA) at 1 and 10 mM. Data were expressed as mmol or nmol per fresh weight (F.W.). Different lowercase letters above columns indicate significant differences between treatments (p < 0.05).

