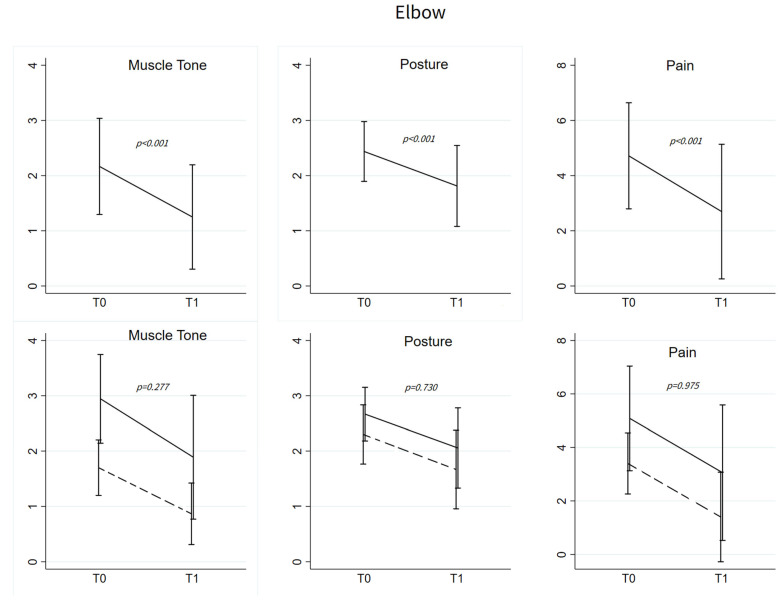
Figure 2.
Elbow flexors. (Upper): Mean ± SD of muscle tone, posture and pain at T0 and T1; p-values refer to the evaluation of the change from T0 based on the linear mixed models with random intercept for muscle tone and pain and to mixed-effects ordered logistic regression model for posture scores. All the models were adjusted for age and sex. Muscle tone and posture T0-T1 changes were evaluated for all the patients (n = 48), while improvement in pain was studied only among patients with pain at T0 (n = 23). (Below): Mean ± SD of muscle tone, posture and pain at T0 and T1 among patients with normal p-ROM (dashed line) and abnormal p-ROM (solid line) at T0. p-values refer to the comparison of the pattern changes between the two groups testing the Time*Group interaction in linear mixed models or in the mixed-effects ordered logistic model.

