Fig. 4.
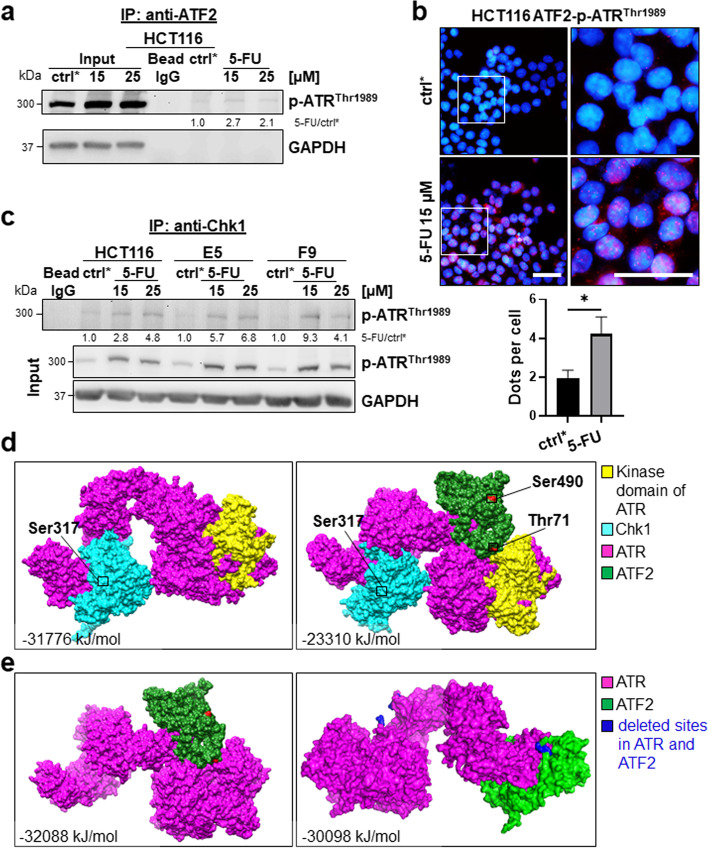
Interaction between ATF2 and ATR. a Co-IP performed with an anti-ATF2 antibody in HCT116 cells. The Co-IP or whole cell extract (Input) was subjected to SDS–PAGE followed by Western blotting; ctrl*: 48 h DMSO treated cells, GAPDH was used as loading control for input. Band intensities were quantified using ImageJ analysis software, and ratios were calculated against the corresponding ctrl* band intensity. b The ATF2-p-ATRThr1989 complex was analysed by proximity ligation assay (PLA) on a fluorescence microscope. The interaction between ATF2 and p-ATR.Thr1989 was visualized by red PLA dots. Nuclei were counterstained with DAPI. Merged images were taken at 40X magnification, scale bar: 50 μm; right: digitally enlarged images, scale bar: 50 μm. Brightness and contrast were adjusted evenly for all conditions. c Co-IP performed with an anti-Chk1 antibody in HCT116, E5, and F9 cells. The Co-IP or whole cell extract (Input) was subjected to SDS–PAGE followed by Western blotting; ctrl*: 48 h DMSO-treated cells. GAPDH was used as a loading control for input. Band intensities were quantified using ImageJ analysis software, and ratios were calculated against the corresponding ctrl* band intensity. d Modelling of ATF2 and Chk1 was obtained by homology structural modelling using MODELLER v10.0: ATF2 (green) was modelled using two X-ray crystallographic structures, 6ZQS_chainB and 1T2K_chainD, and one NMR structure, 1BHI, as templates; Chk1 protein (cyan) was modelled using two X-ray crystallographic structures, 2X8D and 5WI2_A, as templates; the remaining portions were predicted using RaptorX. The modelled structures of ATF2 and Chk1 were subjected to energy minimization using GROMACS. Based on the lowest energy values and fewest Ramachandran outliers obtained from ProCheck, the final modelled structures of ATF2 and Chk1 were chosen. ATR (purple) was derived from the complete cryo-EM structure of the human ATR-ATRIP complex (PDB: 5YZ0, resolution 4.70 A). ATR kinase domain (yellow). The ATR-Chk1 complex was generated by docking individual protein structures using the protein‒protein docking server ClusPro. Cluster scores of the complexes from ClusPro were utilized to select the ATR-Chk1 complex. This complex was further used to dock the ATR-Chk1 complex with ATF2. Finally, the protein complexes were analysed using the PDBePISA (Proteins, Interfaces, Structures and Assemblies) tool to determine the binding energy and dissociation pattern of the docked complex. e Modelling of the ATR and ATF2 interaction upon deletion of the binding sites. Active site pockets of ATR and ATF2 were predicted using the CASTp online server [27]. The interacting active site residue region of ATR and ATF2 was knocked out from the complex using Pymol [28], further protein‒protein docking was carried out using the ClusPro server, and interactions were calculated. The energies of the developed models and complexes were computed using the Gromos96 force field [26]

