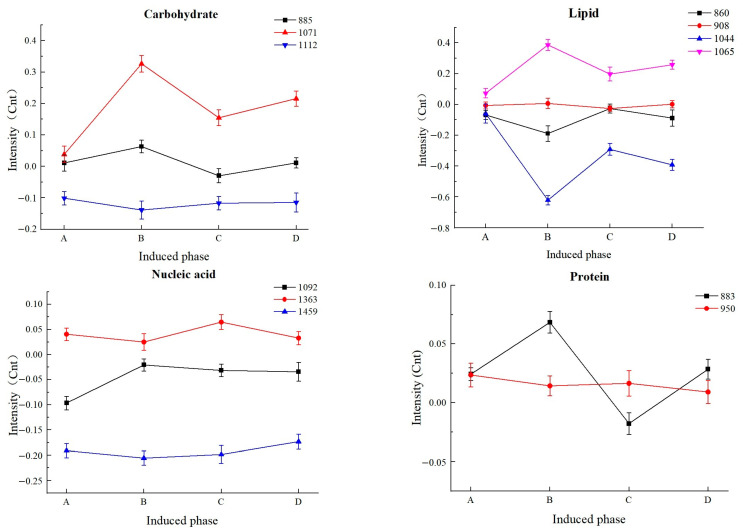
Figure 10.
Changes in the signal intensity of intracellular constituent peaks during different induction stages of Lacticaseibacillus paracasei Zhang. The numbers specified in each plot represent the Raman frequency of each peak. (A) Healthy. (B) 120 days of induction. (C) 180 days of induction. (D) 220 days of induction.

