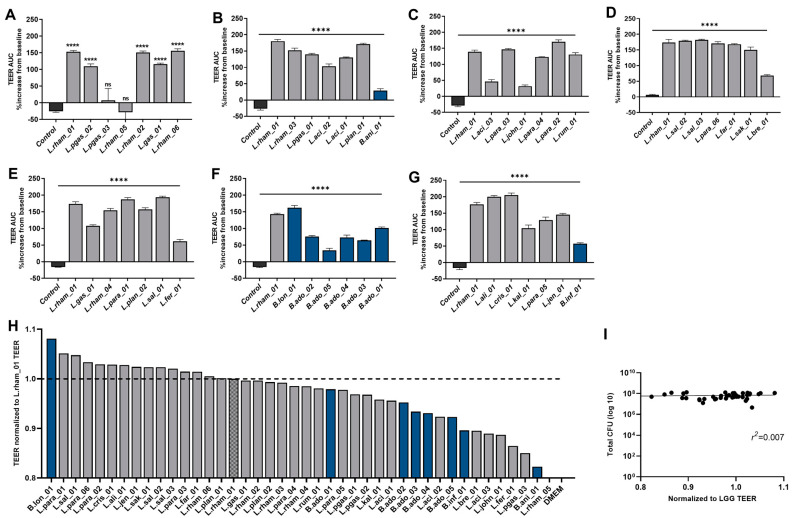
Figure 1.
Modulation of barrier integrity by 42 individual bacterial strains. (A–G) Results from individual TEER runs shown as TEER area under the curve after 8 h normalized to percentage increase from baseline measurements. Blue bars correspond to Bifidobacterium strains, and dark gray to Lactobacillus strains. Co-cultures were tested in triplicate and error bars indicate SD. Results were compared with the unstimulated control via a one-way ANOVA with Dunnett’s post-hoc analysis for multiple comparisons: **** p < 0.0001, ns: not significant. (H) The 42 bacterial strains ranked according to respective TEER readings of Caco-2 monolayers at 8 h incubated with viable bacteria. Data were normalized to positive control (L.rham_01 = 1; dotted line). Each blue bar corresponds to Bifidobacterium strains, and dark gray to Lactobacillus strains. DMEM AB-free media was used as a negative control. Bars represent the mean of triplicates. (I) Association between added colony forming units (CFU) and TEER response tested by linear regression.

