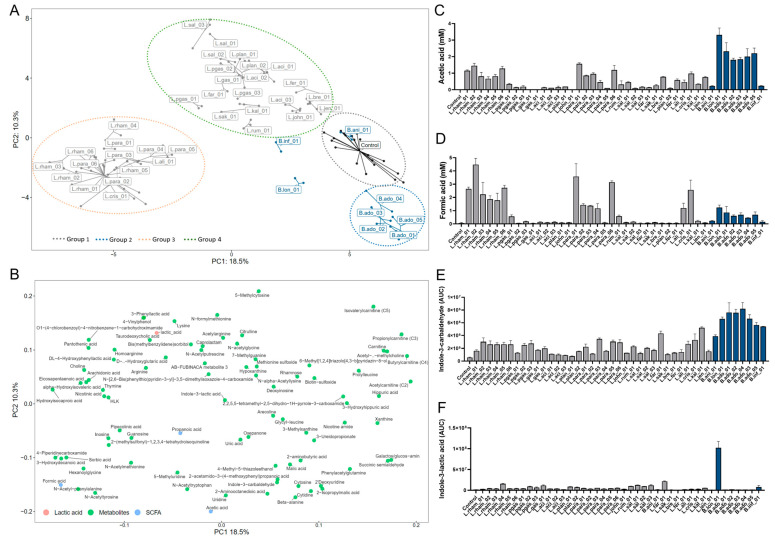
Figure 2.
Bacterial-derived metabolite profiles. (A) Principal component analysis (PCA) of metabolites (level 1, 2a, 2b and SCFAs) labeled by strain ID and colored by genus: gray = Lactobacillus strains, blue = Bifidobacterium strains, black = controls (n = 21). (B) Metabolite loading plot showing the metabolites driving sample-position on PC1 and PC2 (blue = SCFAs, green = semi-polar metabolites). (C,D) Quantified acetic acid and formic acid production post co-incubation. Blue bars correspond to Bifidobacterium strains, and dark gray to Lactobacillus strains. All strains were tested in triplicate and error bars indicate SD. (E,F) Production of the microbial-derived tryptophan catabolites: Indole-3-carbaldehyde (ICA) and Indole-3-lactic acid (ILA) depicted as AUC. Blue bars correspond to Bifidobacterium strains, and dark gray to Lactobacillus strains. All strains were tested in triplicate and error bars indicate SD.

