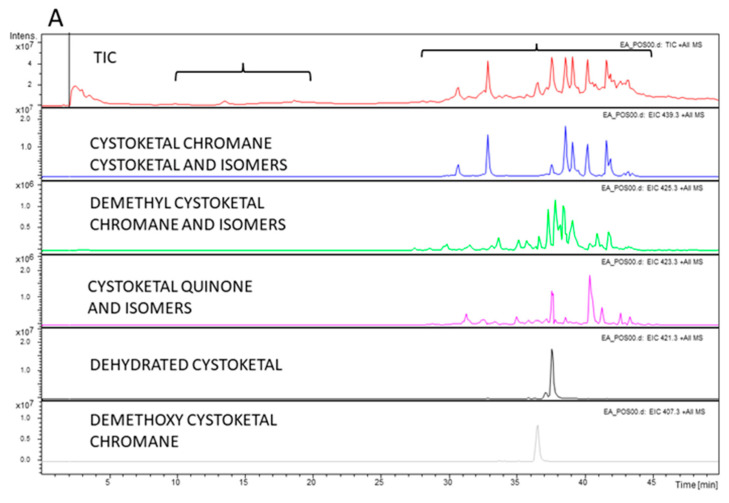
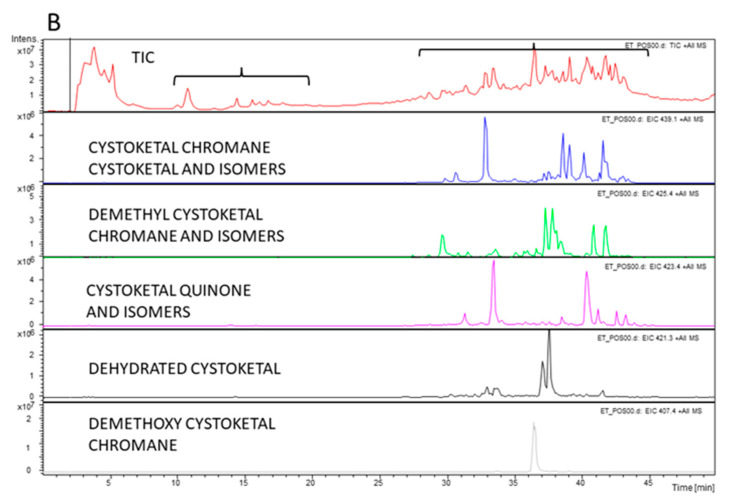
Figure 9.
HPLC/MS analyses of the EtOH extracts. Total ion current (TIC) and extracted ion chromatograms (EIC) obtained by full-scan MS/MS analysis coupled to HPLC separation of an aliquot of the E. amentacea apices hydroalcoholic (A) and thalli (B) extracts at a starting dilution of 2.5 mg/mL (injection volume, 8 μL), acquiring the most abundant species under each peak. The red chromatogram in both panels represents the TIC of each extract, while the following blue, green, pink, black and gray chromatograms in both panels represent the EICs of the molecules indicated in the respective panels. The acquisition was performed on negative and positive ions in the 100–1000 mass range and analyzed using integrated software.


