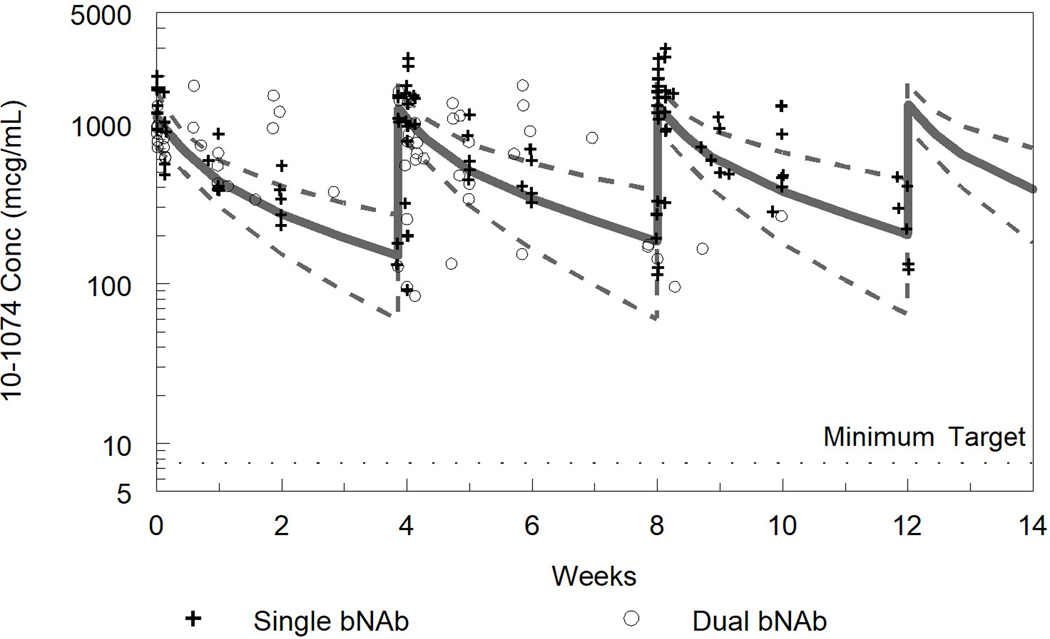
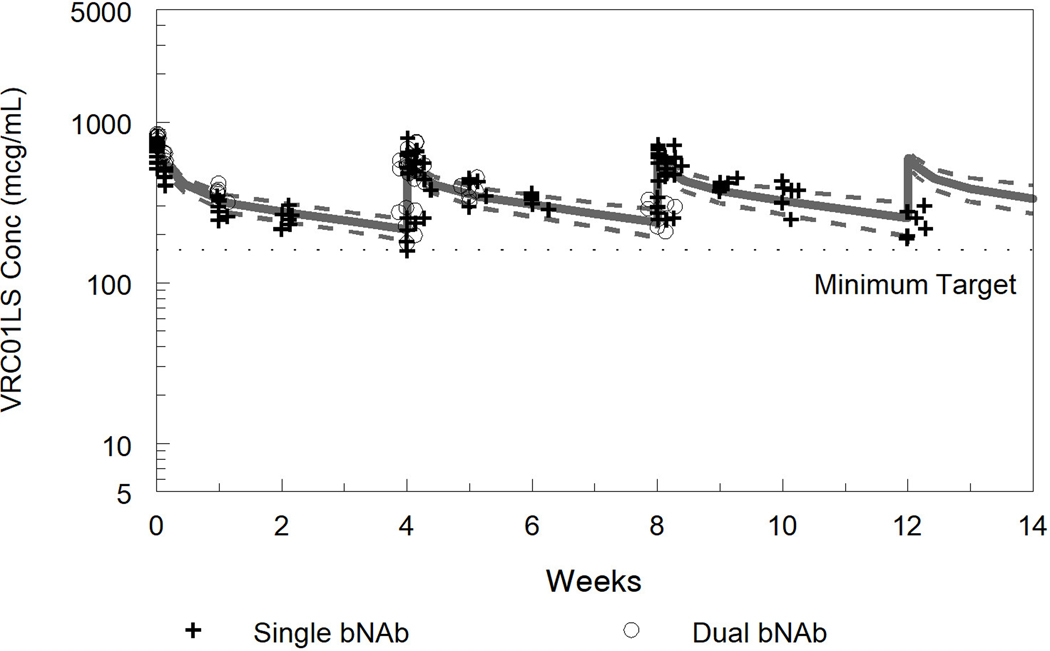
Fig. 2. Measured and model predicted 10–1074 concentrations (a) and VRC01LS concentrations (b).
For the model predicted concentrations the solid line represents the median and dashed lines the 5th and 95th percentiles from the popPK model simulations. Observed concentrations from Phase A, bNAb alone, are represented as “+” and Phase B, bNAb in combination, as “o”. For VRC01LS Phase A, concentrations after the second and third doses were normalized to the 15 mg/kg dose in Phase B.


