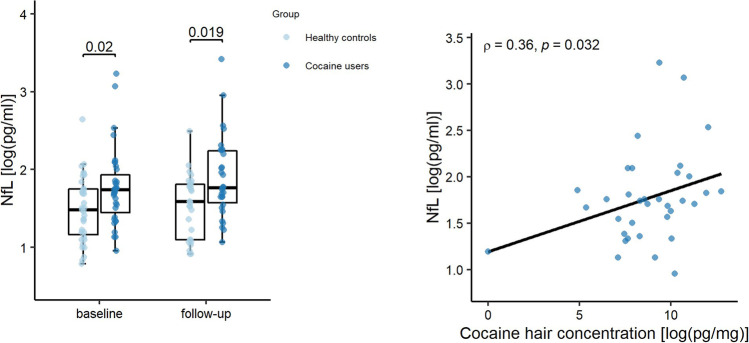
Fig. 1.
NfL levels in healthy controls and chronic cocaine users. Left panel: Boxplots showing individual plasma NfL levels (log-transformed). Central horizontal lines indicate median values; boxes illustrate the ranges between lower and upper quartiles. Right panel: Scatterplot showing the relationship between hair concentration of cocainetotal and plasma NfL levels at baseline (both log-transformed). Cocainetotal (= Cocaine + Benzoylecgonine + Norcocaine) is, together with the corresponding metabolic ratios, a more robust procedure for discrimination between incorporation and contamination of hairs. Abbreviations: HC: Healthy Controls; CU: Cocaine Users; NfL: neurofilament light chain

