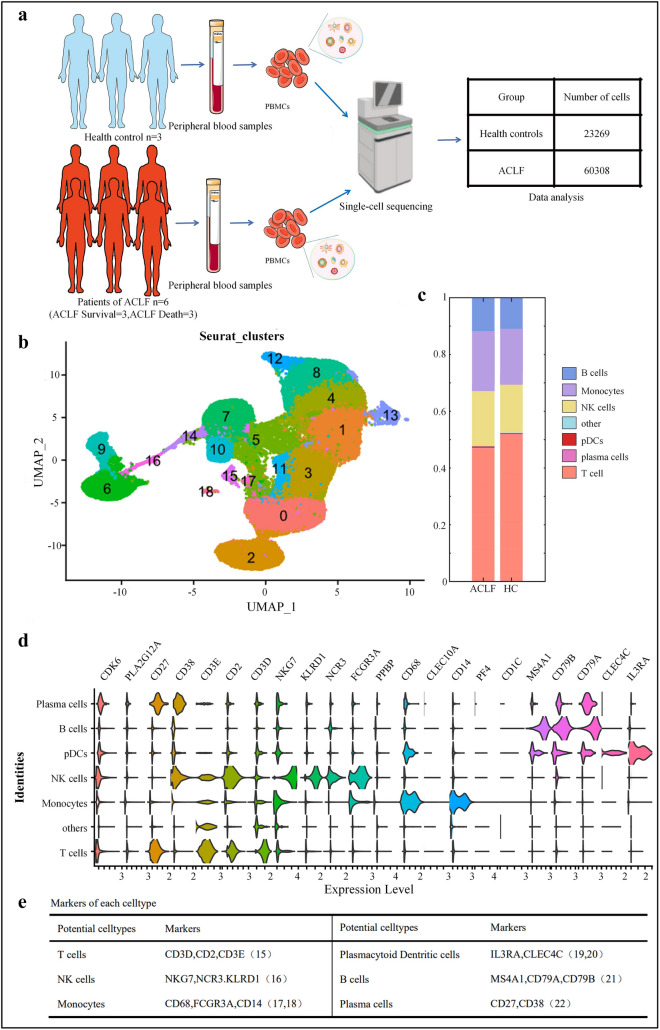
Fig. 1.
Unsupervised cluster analysis on single-cell RNA-seq data. A Work flow of PBMCs isolation and single-cell RNA-Seq. B Cell subpopulations detected and their UMAP plots. C Proportional bar charts of cell subpopulations in ACLF patients and healthy controls (colors are coded for the cell subpopulations identified in this study). D Violin plots showing the expression levels of marker genes for defined cell subpopulations revealed by single-cell sequencing. The distribution of cell subpopulation-specific marker genes across all clusters reflects their cell types. E Table shows the marker genes of cell types defined in D

