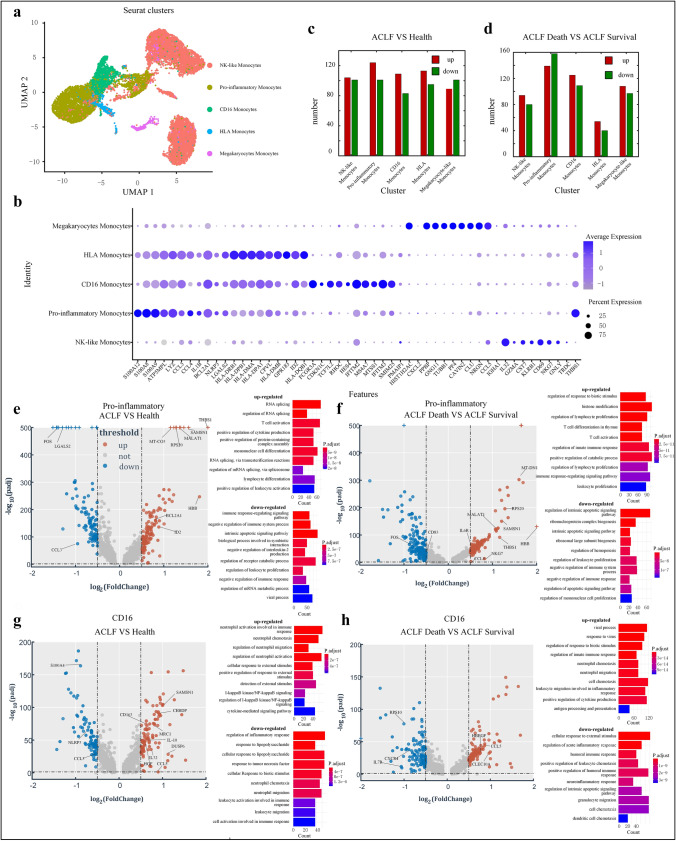
Fig. 3.
Unique immunological profile of monocytes in ACLF. RNA sequencing was performed on the monocytes of 3 healthy controls and 6 ACLF patients (including 3 patients in the ACLF death group and 3 in the ACLF survival group). A The 4239 ACLF monocytes on UMAP are further divided into 5 subpopulations, whose names are annotated on the left, and different colors are used to distinguish each cluster. B Dot plot curve showing the top 10 marker genes revealed by single-cell sequencing of ACLF monocyte subpopulations. C The number of up- and down-regulated genes per monocyte subpopulation when comparing gene expression changes between ACLF patients (n = 6) and healthy controls (n = 3). The number of genes with log-fold change (Fc) > 0.5 and adjusted P value < 0.05 in each subpopulation were as follows: 104 genes up-regulated and 101 down-regulated in NK-like Monocytes subpopulation; 124 genes up-regulated and 101 down-regulated in pro-like monocytes subpopulation; 109 genes up-regulated and 83 down-regulated in CD16 monocytes subpopulation; 113 genes up-regulated and 95 down-regulated in HLA monocytes subpopulation; 89 genes up-regulated and 101 down-regulated in megakaryocyte-like monocytes subpopulation. D The number of up- and down-regulated genes per monocyte subpopulation when comparing gene expression changes between ACLF death group (n = 3) and ACLF survival group (n = 3). The number of genes with log-fold change (Fc) > 0.5 and adjusted P value < 0.05 in each subpopulation were as follows: 94 genes up-regulated and 80 down-regulated in NK-like Monocytes subpopulation; 139 genes up-regulated and 158 down-regulated in Pro-like Monocytes subpopulation; 125 genes up-regulated and 109 down-regulated in CD16 Monocytes subpopulation; 54 genes up-regulated and 40 down-regulated in HLA Monocytes subpopulation; and 108 genes up-regulated and 97 down-regulated in megakaryocyte-like monocytes subpopulation. The volcano plots show all the up-regulated (red) and down-regulated (green) genes in monocytes when: E. comparing pro-inflammatory monocytes between healthy controls and ACLF patients; F comparing CD16 monocytes between healthy controls and ACLF patients; G comparing Pro-inflammatory Monocytes between ACLF death group and ACLF survival group; H comparing monocytes between ACLF survival group and ACLF death group. The top 10 biological processes of the differentially expressed genes were identified

