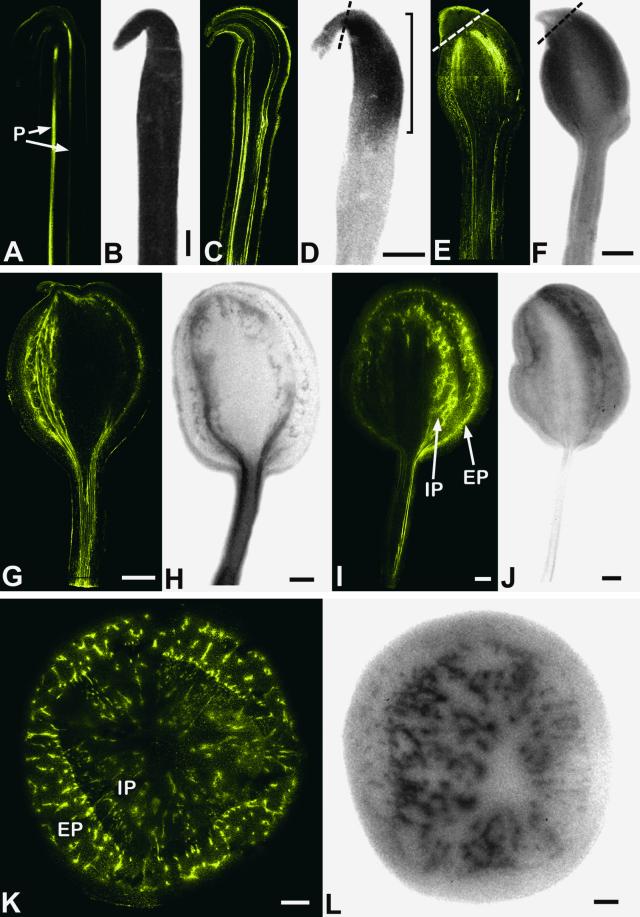
Figure 2.
Confocal Laser Scanning Microscopy of CF Unloading in Comparison with 14C Autoradiography.
(A) In nonswelling stolons, CF was restricted to the phloem (P) in both the stolon axis and hook regions.
(B) In stolons of the same developmental stage, 14C was distributed evenly across the stolon axis and hook.
(C) In stolons showing the first detectable subapical swelling, CF remained confined to the phloem strands.
(D) At the same stage, 14C was unloaded uniformly across the subapical (bracketed) region of the tuberizing stolon. Note the decrease in labeling intensity of the apical region (acropetal to dotted line).
(E) In visibly swollen stolons, CF showed distinct subapical unloading into parenchyma tissues. Note lack of dye movement into apical tissues (acropetal to dotted line).
(F) Autoradiography of swelling stolon shows similar pattern to (E). The apical region (acropetal to dotted line) again shows less labeling than subapical tissues.
(G) to (J) Visibly swollen tubers unloading CF and 14C, respectively. Unloading is apparent from both internal (IP) and external (EP) phloem networks.
(K) Transverse section of growing tuber unloading CF. Extensive dye unloading is apparent from internal and external phloem networks.
(L) Autoradiograph of tuber at a stage of development similar to that shown in (K).
 .
.  .
.  .
.  to
to  and (L)

