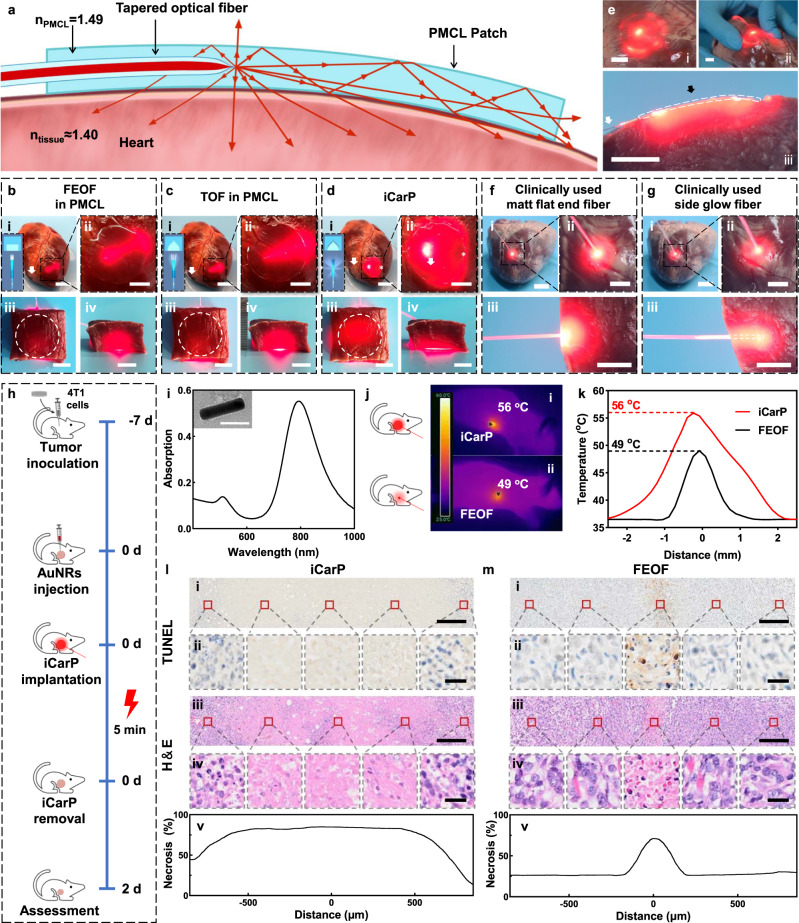
Fig. 4. Comparison of illumination scopes and depths, and tumor photothermal ablation effects of different optical fiber/patch photonic devices.
a Cross sectional scheme of the iCarP optical path. b–d Panorama (i) and magnified images (ii) of ex vivo porcine hearts illuminated by the photonic devices: FEOF in PMCL (b), TOF in PMCL (c), and iCarP (d), insets: optical fiber end structures and corresponding light scattering diagrams, (i) scale bars = 2.5 cm; (ii) scale bar = 1 cm. White arrows indicate the optical fibers. Top view (iii) and front view (iv) of 1.5 cm thick heart tissue illuminated by corresponding photonic devices (devices completely covered by the heart tissue; their locations were indicated by white circles), scale bar = 1 cm. e ICarP illumination on ex vivo porcine hearts, scale bar = 1 cm. White arrows indicate the optical fibers, black arrow indicates the location of the air gap. (i) Porcine heart illuminated by iCarP at a lower power compared to that in (d), showing the distribution of scattered light. (ii) iCarP illumination on distorted porcine heart. (iii) Cross section of iCarP and porcine myocardium in the same configuration as in (a). f, g Illumination scopes and depths of clinically used matt flat-end optical fiber (f) and side glow optical fiber (g). Panorama (i), magnified images (ii) and cross section (iii) of illuminated porcine hearts. Scale bar = 1 cm. h Timeline of the animal study. i Light absorption spectrum of AuNRs, inset: representative TEM image of > 100 AuNRs. Scale bar = 50 μm. j Infrared thermal imaging of mice illuminated by iCarP (i) and FEOF (ii). k Temperature of mice illuminated by iCarP (i) and FEOF (ii). l, m Therapeutic effect of iCarP (l) and FEOF (m) illumination (representative for n = 3 biologically independent samples). (i) Representative TUNEL staining images of illuminated tumor, scale bar = 200 μm. (ii) TUNEL staining images, scale bar = 20 μm. (iii) Representative H&E staining images of illuminated tumor, scale bar = 200 μm. (iv) Magnified H&E staining images, scale bar = 20 μm. (v) Quantitative analysis of necrosis based on H&E staining.

