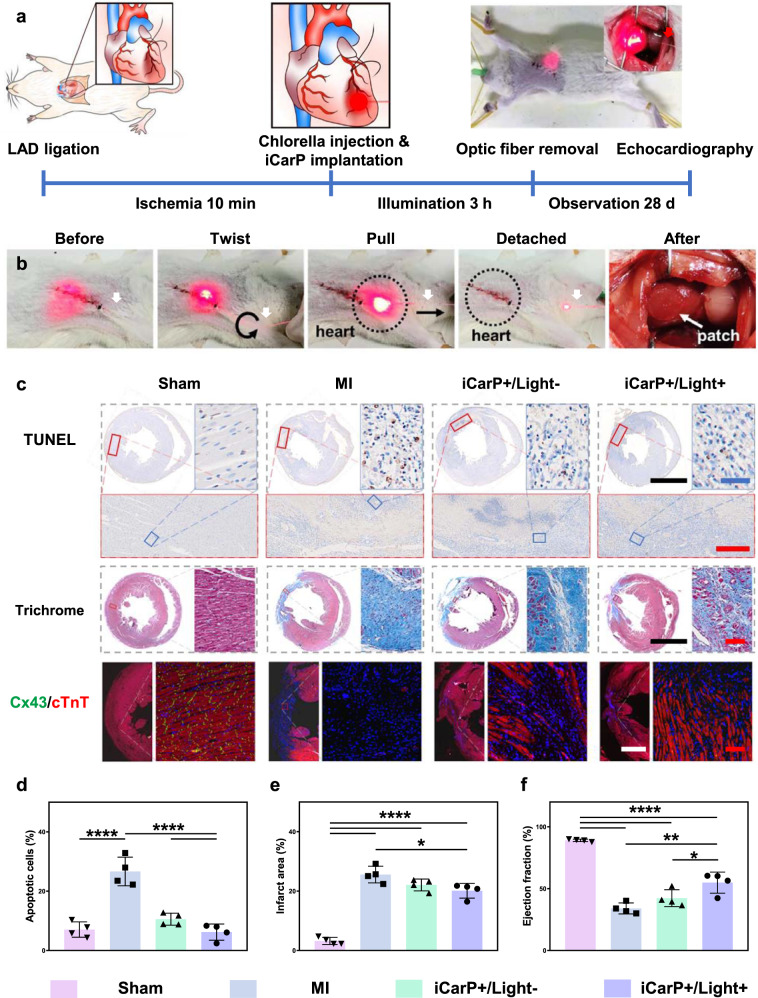
Fig. 5. Myocardial infarction treatment with iCarP illumination induced in situ photosynthesis.
a Timeline of the animal study. Sham group: rats underwent thoracotomy only without LAD ligation; MI group: rat underwent LAD ligation, without treatment; iCarP + /Light- group: MI rats received chlorella injection and iCarP implantation, without illumination; iCarP + /Light+ group: MI rats received chlorella injection and iCarP illumination. b Removal of TOF after treatment while chest is closed. c Histological evaluation of therapeutic outcome by in situ photosynthesis: representative TUNEL staining images of hearts sections 3 d after MI (apoptosis); representative Masson’s trichrome staining of rat hearts 28 d after MI (fibrosis); representative immunofluorescence staining images of Cx43 (green), cTnT (red), and nuclei (blue) in LV 28 d after MI (down). Scale bars in TUNEL staining images: black = 5 mm, red = 500 μm, blue = 50 μm, scale bars in other staining images: black = 5 mm, red = 100 μm, white = 2 mm. d–f Quantitative analysis of (d) apoptotic cells, (e) infarct area, and (f) ejection fraction based on TUNEL staining, Masson’s trichrome staining, and day 28 echocardiography, respectively (n = 4 per group). Statistical significance was calculated using one-way ANOVA with Tukey’s posttest and data are presented as means ± SD. ∗p < 0.05, ∗∗p < 0.01, ∗∗∗p < 0.001, ∗∗∗∗p < 0.0001. Source data and exact p-values are provided in the Source Data file.

