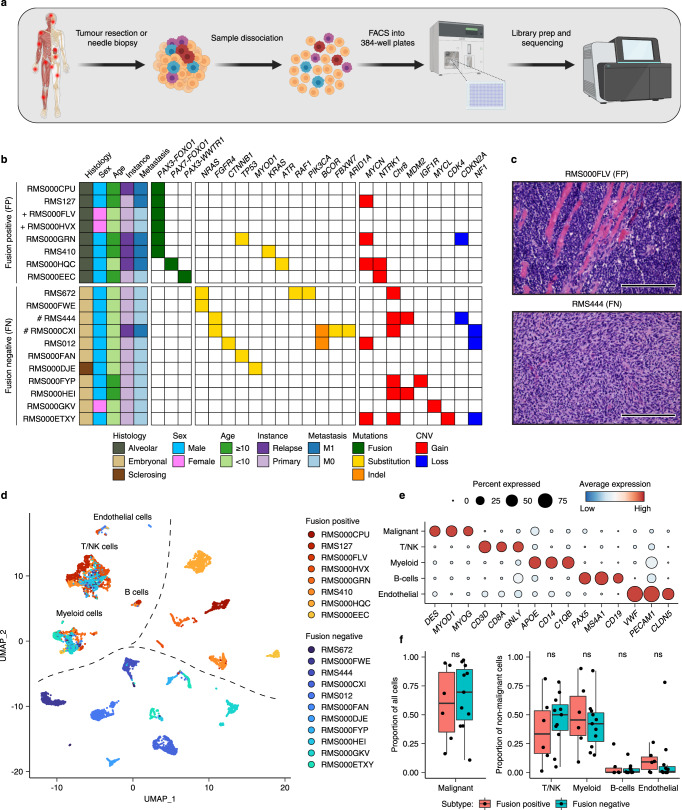
Fig. 1. Single-cell transcriptomic atlas of RMS tumours.
a Schematic representation of the sample processing workflow used to generate scRNA-seq data from primary samples. Created with BioRender. b Overview of RMS sample cohort, including patient clinical characteristics, as well as a summary of relevant mutations and copy number variants (CNV) in tumours, defined using bulk DNA sequencing. ( + ) and (#) indicate independent samples derived from the same patient. c Representative haematoxylin and eosin (H&E) stained tumour sections depicting the two major RMS histological subtypes (alveolar and embryonal) in this cohort. Scale bars are equivalent to 200 µm. Images representative of stained sections from all samples in the primary cohort (n = 19) d UMAP projection of single-cell RMS transcriptomes from primary samples (n = 7364) coloured by sample. e Dot plot depicting the average scaled gene expression of selected marker genes for each annotated cell type (dot colour). Dot size corresponds to the percentage of cells expressing each gene. f Boxplots comparing the proportion of malignant cells (left panel) and each non-malignant cell type (right panel) between molecular subtypes (n = 17 biologically independent samples). ns = not significant (p > 0.05, two-sided student’s t test). Both panels exclude bone marrow aspirate samples. The mean is used as the centre measurement for each box, which encloses the range between the first and third quartiles. Whiskers extend to the largest (or smallest) values no further than 1.5× the inter-quartile range (IQR) from the box hinges. Source data are provided as a Source Data file.

