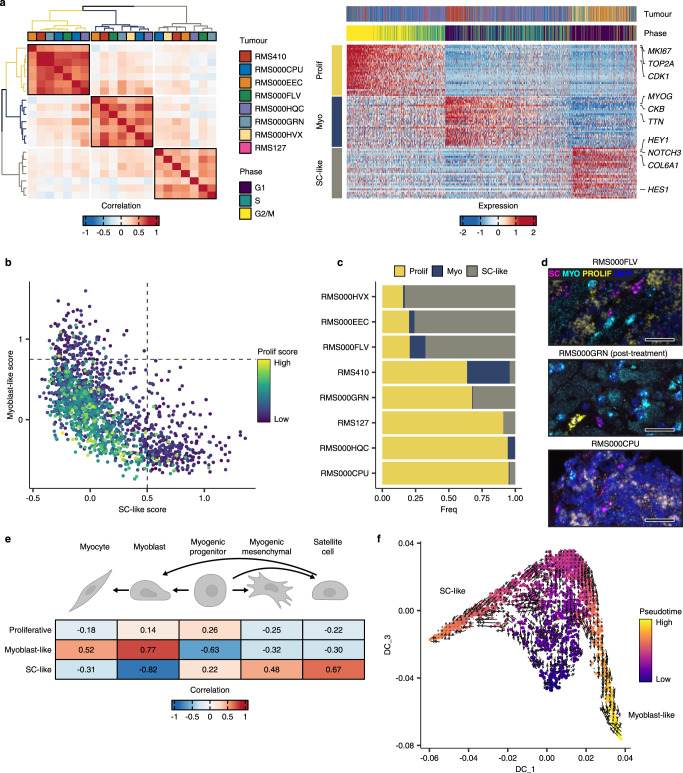
Fig. 4. Cell states in FP RMS tumours mirror skeletal muscle myogenic differentiation.
a Left panel: Heatmap showing the pairwise Pearson correlations between all NMF-defined transcriptional programs in FP samples. The tumour sample from which each transcriptional program was derived is shown in the colour bar. Meta-program clusters are delineated by black boxes and colouring of the dendrograms. Right panel: Scaled expression of the top 30 genes per meta-program across all FP cells (Myo = Myoblast-like, Prolif = Proliferative and SC-like = Satellite cell-like). The corresponding tumour sample and inferred cell cycle phase of each cell are displayed in the top annotation bar. Representative genes from each meta-program are labelled. b Scatterplot depicting per cell meta-program scores. Dotted lines correspond to the cut-offs used to define discrete cell states. c Proportion of cells within each discrete state, per FP tumour. d Representative RNA fluorescence in-situ hybridisation (RNA-FISH) images depicting the expression of satellite cell-like (magenta, SC = NOTCH3), myoblast-like (cyan, MYO = TTN) and proliferative (yellow, PROLIF = MKI67) cell state marker genes in FP tissue samples. DAPI counterstaining shown in blue. Scale bars equivalent to 25 µm. e Heatmap depicting the Pearson correlations between FP cell-state scores, and the logistic regression-defined similarity scores (logits) for each normal myogenic cell type. f Diffusion maps projection of FP RMS single cells, coloured by pseudotime value, overlaid with the RNA velocity vector field. Myogenic differentiation schematic was created with BioRender. Source data are provided as a Source Data file.

