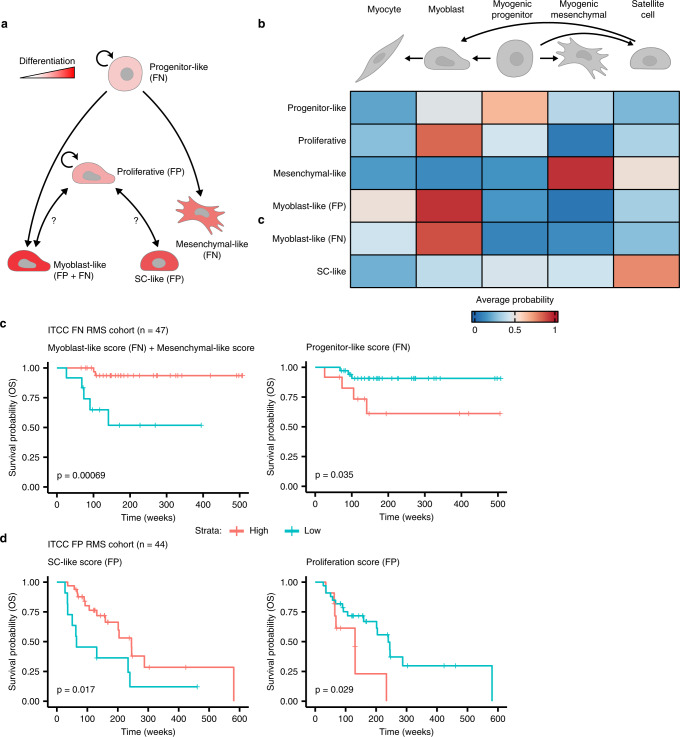
Fig. 5. Malignant cell states are predictive of patient outcomes.
a Schematic representation of differentiation trajectories in RMS. Created with BioRender. b Heatmap showing the average predicted similarity (probability) between discrete malignant cell states from both RMS molecular subtypes (y-axis) and normal myogenic cell types, as determined by logistic regression analysis. Myogenic differentiation schematic was created with BioRender. c, d Kaplan-Meier plots showing the overall survival probabilities of (c) FN (n = 47) or (d) FP (n = 44) patients divided into high (red strata) or low (blue strata) groups based on their cell state scores (stated in the title of each plot panels). Log-rank test was used to calculate p values between high- and low-scoring groups. Source data are provided as a Source Data file.

