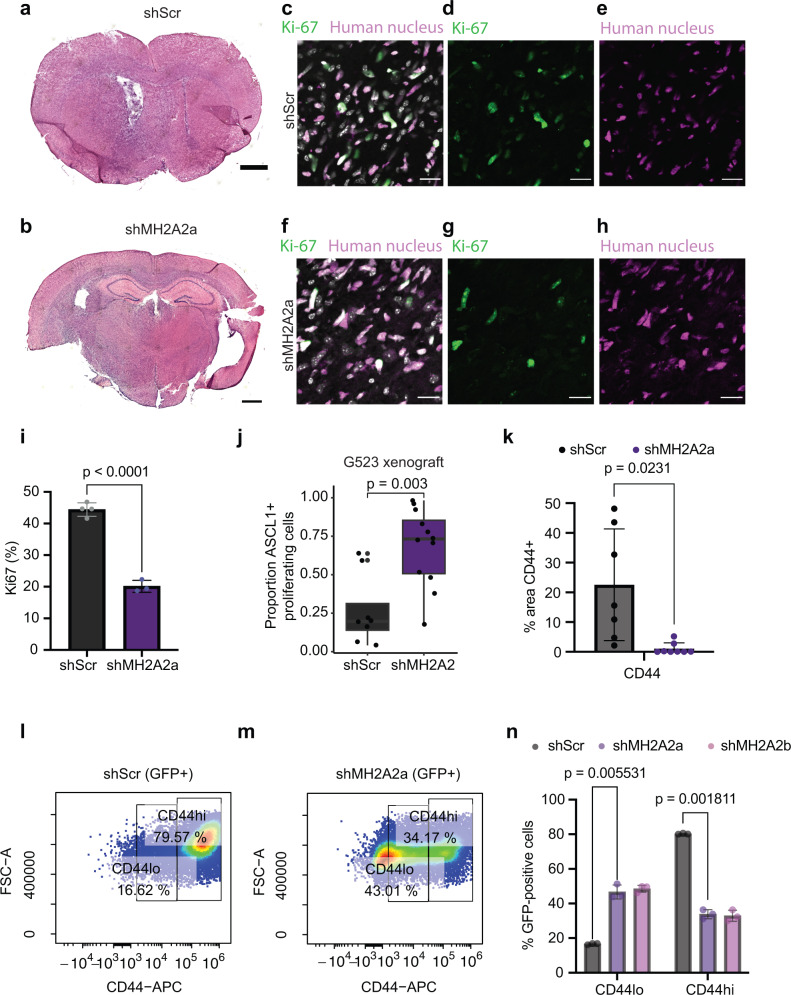
Fig. 3. macroH2A2 knockdown leads to enhanced proneural phenotypes in vivo and inhibits CD44-positive cell states.
a, b Representative whole-mount hematoxylin-eosin images of mouse tumors. Scale bar: 1 mm. The experiment was performed once on three mouse tumors per condition. c–h Confocal microscopy images of Ki-67 and human nucleus staining from scramble [merge (c), Ki-67 (d), and human nucleus (e)] and shMH2A2 knockdown animals [merge (f), Ki-67 (g), and human nucleus (h)] Scale bar 20 mm. i Quantification of human Ki-67 positive cells in control versus knockdown mice (p value: two-tailed unpaired T-test); quantification performed over three 10x fields and repeated in two animals). Error bars represent standard deviation. j Quantification of ASCL1-Ki-67 immunohistochemistry in G523 xenograft mice, across n = 8 and n = 12 independent low-power fields in n = 2 distinct animals. The experiment was repeated twice. P value: two-tailed unpaired T-test with Welch’s correction. The boxplot line represents the median, hinges at 25th and 75th percentiles, and whiskers at 1.5 × IQR. k Quantification of CD44 signal in mouse xenografts (p = 0.0231; two-tailed unpaired T-test); experiment performed in two animals and quantified over at least seven 10x fields. Error bars represent standard deviation. l–n Flow cytometric analysis of CD44 signal in G523 cells; representative scatterplots of control (l) and knockdown (m) along with quantification (n) performed with three biological replicates (p versus shMH2A2a 0.005531 and 0.001811 versus control for CD44-low and CD44-high cells; two-tailed two-tailed unpaired T-test with Welch’s correction). Error bars represent standard deviation.

