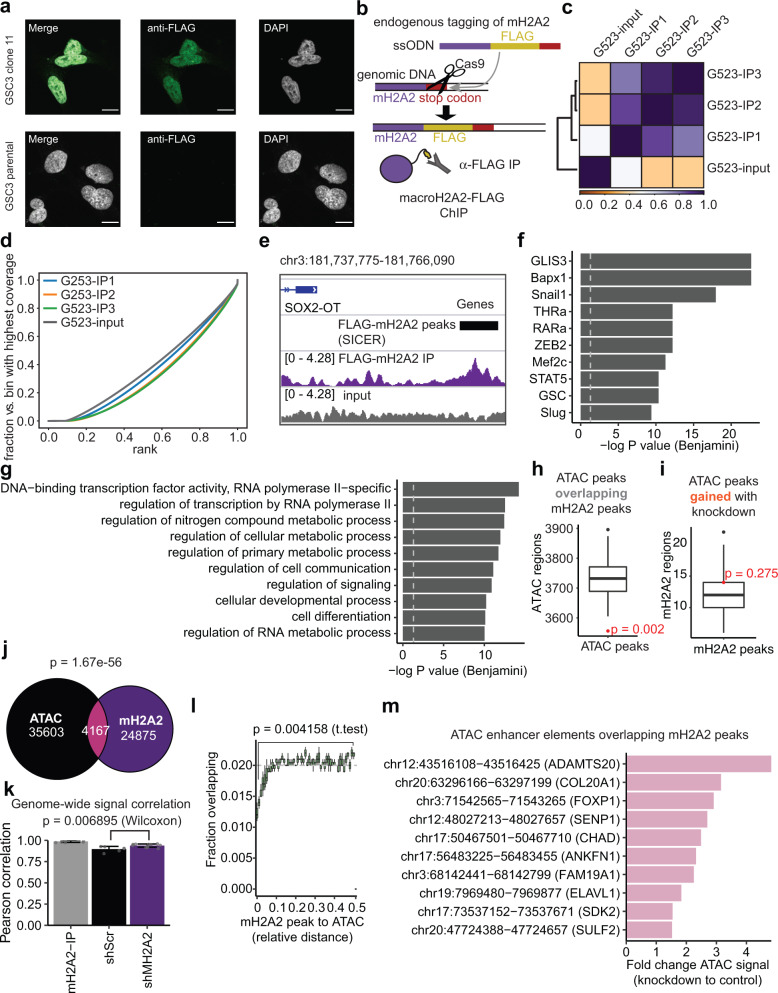
Fig. 6. Characterization of chromatin binding patterns of macroH2A2 in glioblastoma stem cells.
a Immunofluorescence microscopy of FLAG-tagged GSC3 tumor cells versus control. Scale bar: 10 mm. The experiment was performed twice on two independent FLAG-tagged clones. b Overview of endogenous tagging strategy. ssODN single-stranded oligodeoxynucleotide template. c Heatmap of signal correlation between FLAG-macroH2A2-IP samples and control. d Fingerprint plot of FLAG-macroH2A2 ChIP samples versus control. e Example of a peak call and associated signal track. f Top ten motifs associated with ChIP-seq macroH2A2 peaks. P value: hypergeometric test with Benjamini correction. g Top Gene Ontology terms associated with macroH2A2 peaks. P value: hypergeometric test with Benjamini correction. h Permutation analysis of macroH2A2 peaks examining overlap with ATAC peaks (n = 500 permutations; P value by hypergeometric test). i Permutation analysis of ATAC-seq peaks that gain accessibility in knockdown cells overlapping with macroH2A2 peaks. (n = 500 permutations; P value by hypergeometric test). The boxplot line represents the median, hinges at 25th and 75th percentiles, and whiskers at 1.5 × IQR. j Venn diagram comparing macroH2A2 peaks, ATAC-seq peaks, and their overlap (p value—expected overlap by Fisher’s test). k Pearson correlation of signal across the entire genome between macroH2A2-IP samples and control and knockdown ATAC-seq samples. Pairwise comparisons across n = 3 biological ChIP replicates and n = 2 biological ATAC replicates. Error bars represent standard deviation. P value calculated by Wilcoxon test. l Relative distance plot showing the fraction of overlaps versus expected for macroH2A2 peaks compared to ATAC-seq peaks. Each point represents an average of n = 3 biological replicates of ChIP. Error bars represent standard deviation. P value by unpaired T-test with Welch’s correction. m Top 10 ATAC-seq enhancer elements which overlap macroH2A2 peaks sorted by differential accessibility.

