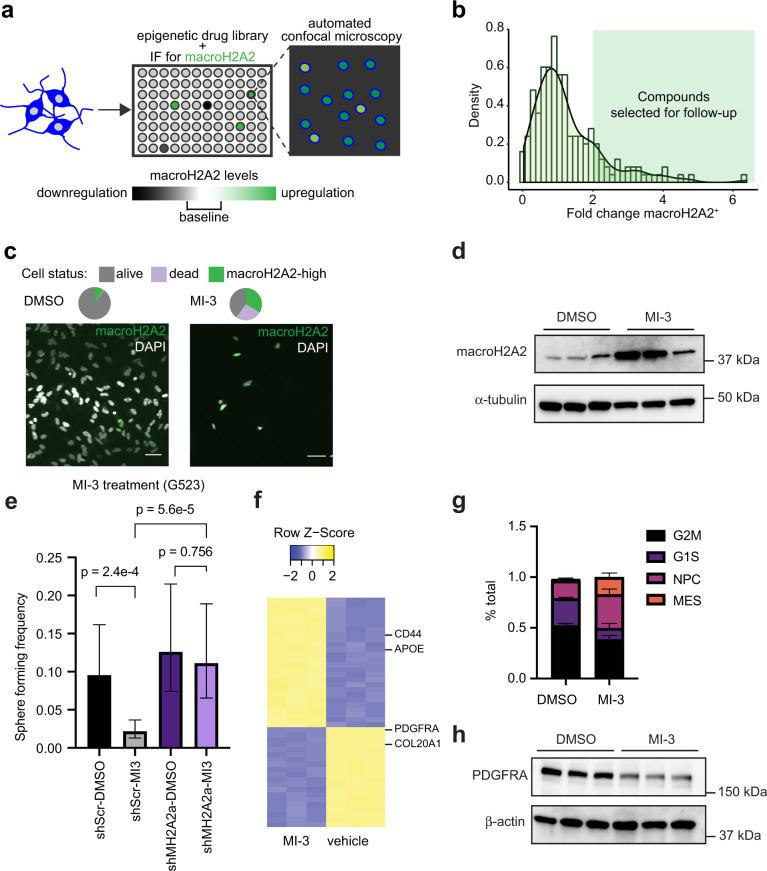
Fig. 7. Identification of chemical compounds that elevate macroH2A2 levels in GBM cells.
a Diagram summarizing our screening strategy to identify compounds that increase macroH2A2 levels. b Normalized density of the log fold change of macroH2A2 positive cells for all compounds in the screen. The green-shaded region represents compounds with greater than a twofold change of macroH2A2 positive cells. c Effects of MI-3 at 1 uM and vehicle control (dmso) on macroH2A2 protein levels were assessed by immunofluorescence. Scale bars: 50 mm. Representative images from one of three biological replicates. The experiment was performed once. d Western blot of macroH2A2 levels after 7 days of treatment with 200 nM of MI-3. Three replicates per condition. e Limiting dilution assay of macroH2A2 knockdown cells versus control GSCs treated with either DMSO or 500 nM of MI-3. Sphere formation estimates from n = 6 biological replicates. P value determined by Chi-square test. Error bars represent a 95% confidence interval of the sphere formation frequency estimate. f Heatmap displaying the top 50 differentially expressed genes between MI-3 and DMSO-treated cells based on RNA-seq data (three biological replicates per treatment). Error bars represent standard deviation. g CIBERSORTx analysis of transcriptional subtypes in MI-3 data (p values: G2M 0.0129; G1S 0.024; NPC 0.029; MES 0.022; two-tailed unpaired T-test with Welch’s correction; n = 2 biological replicates per condition). h Western blot showing levels of PDGFRA and TNFR in MI-3 and DMSO-treated GBM cells after 7 days of treatment in vitro. Three biological replicates per condition. The experiment was repeated two times.

