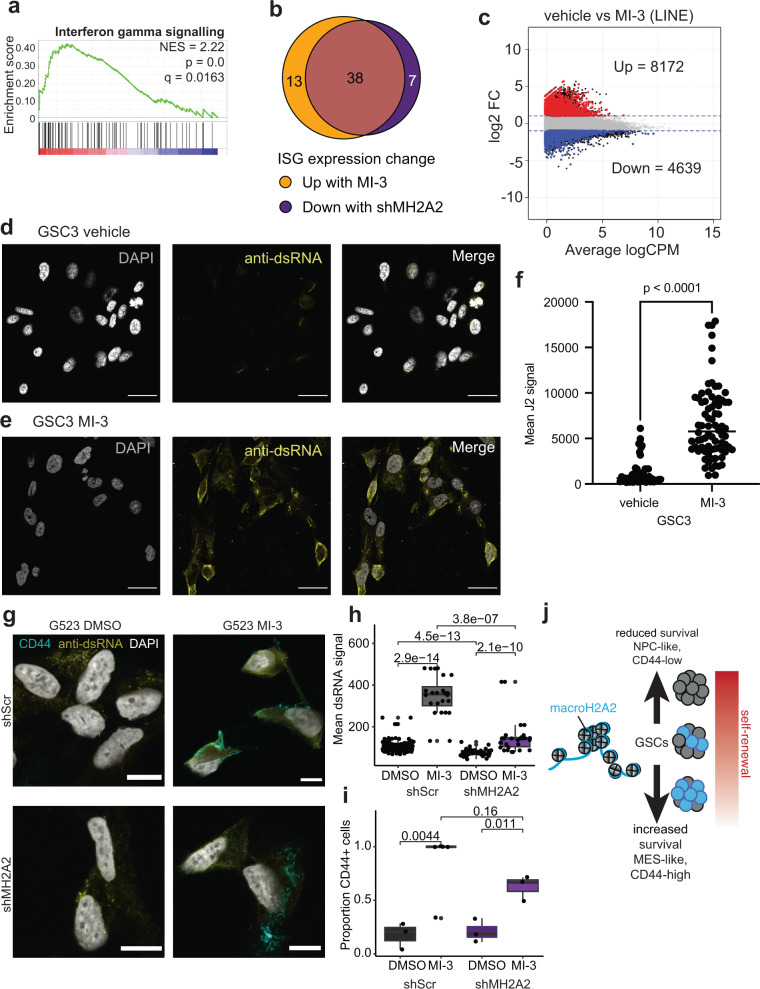
Fig. 8. macroH2A2 is a positive modulator of viral mimicry pathways in GBM.
a GSEA analysis showing increased interferon signaling in MI-3-treated versus vehicle-treated cells. P value represents the hypergeometric test and q value represents the false-discovery corrected P value. b Overlap of interferon-sensitive genes (ISGs) showing expression changes upon MI-3 treatment compared to ISGs differentially expressed upon macroH2A2 knockdown. c Transcriptional levels of LINE repeat elements upon MI-3 treatment were determined by RNA-seq. d–f Staining for double-stranded RNA in vehicle-treated (g) and MI-3 treated (h) GSC3 GBM cells. Scale bar: 25 mm. i Quantification of dsRNA signal per cell in vehicle versus MI-3 treated cells. P value obtained by Mann–Whitney test. The experiment was repeated twice in two different cell lines (G523, GSC3). g–i Immunofluorescence staining for double-stranded RNA and CD44 (g) in vehicle treated versus MI-3 treated control or shMH2A2 G523 GBM cells. Scale bar: 10 microns. h Quantification of dsRNA signal in vehicle versus MI-3 treated cells per cell in at least n = 3 60x fields per condition. P value obtained by two-tailed two-tailed unpaired T-test with Welch’s correction. The boxplot line represents the median, hinges at 25th and 75th percentiles, and whiskers at 1.5 × IQR. i Quantification of the proportion of CD44-positive cells in at least n = 3 60x fields in each condition. The boxplot line represents the median, hinges at 25th and 75th percentiles, and whiskers at 1.5 × IQR. P value obtained by two-tailed two-tailed unpaired T-test with Welch’s correction. The experiment was repeated twice. j Proposed model for the mechanisms of action of macroH2A2 in GSCs.

