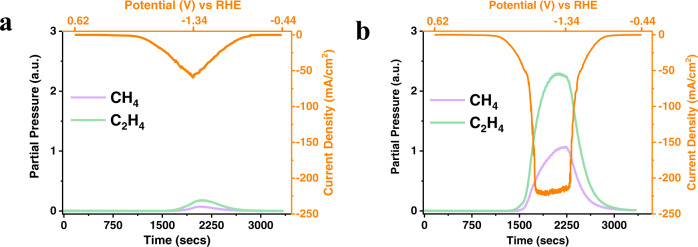
Fig. 4. Real-time analysis of gaseous products as a function of scanning potential.
Cyclic voltammograms and real-time hydrocarbon product distribution detected by mass spectrometer upon CO2 reduction using a parent Cu NPs and b Pd1Cu SAA. The potential was scanned at 1 mV/sec, and mass spectrometer data points were collected every 4 s providing the matching time interval of the online analysis of products as a function of voltage. The measurement was started after reaching the steady-state condition. Potential is scanned from open-circuit voltage to −1.34 V (vs. RHE) and then reversed back to −0.44 V (vs. RHE). (a.u.: arbitrary units).

