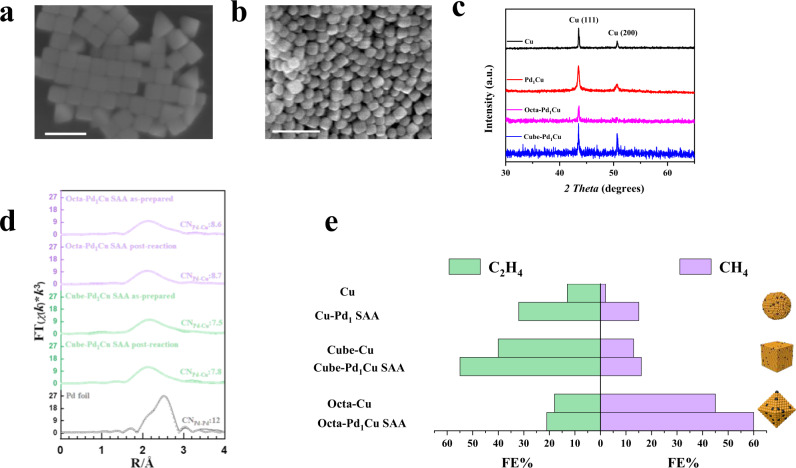
Fig. 5. Effect of Pd on Cu for product distribution during CO2 reduction.
SEM image of a Cube-Cu and b Octa-Cu. The scale bar is 200 nm. c Powder X-Ray diffraction patterns of polycrystalline and shape-controlled Cu nanoparticles and Pd1Cu SAAs. (a.u.: arbitrary units). d Pd K-edge EXAFS (shadowed lines) and the curve-fit (points) for Octa-Pd1Cu SAA as-prepared, Octa-Pd1Cu SAA post-reaction, Cube-Pd1Cu SAA as-prepared, Cube-Pd1Cu SAA post-reaction, and Pd foil are shown in R-space. The data are k3-weighted and not phase-corrected. e The FE distribution of CH4 and C2H4 obtained using Cu and Pd1Cu SAAs (at −1.1 V vs. RHE).

