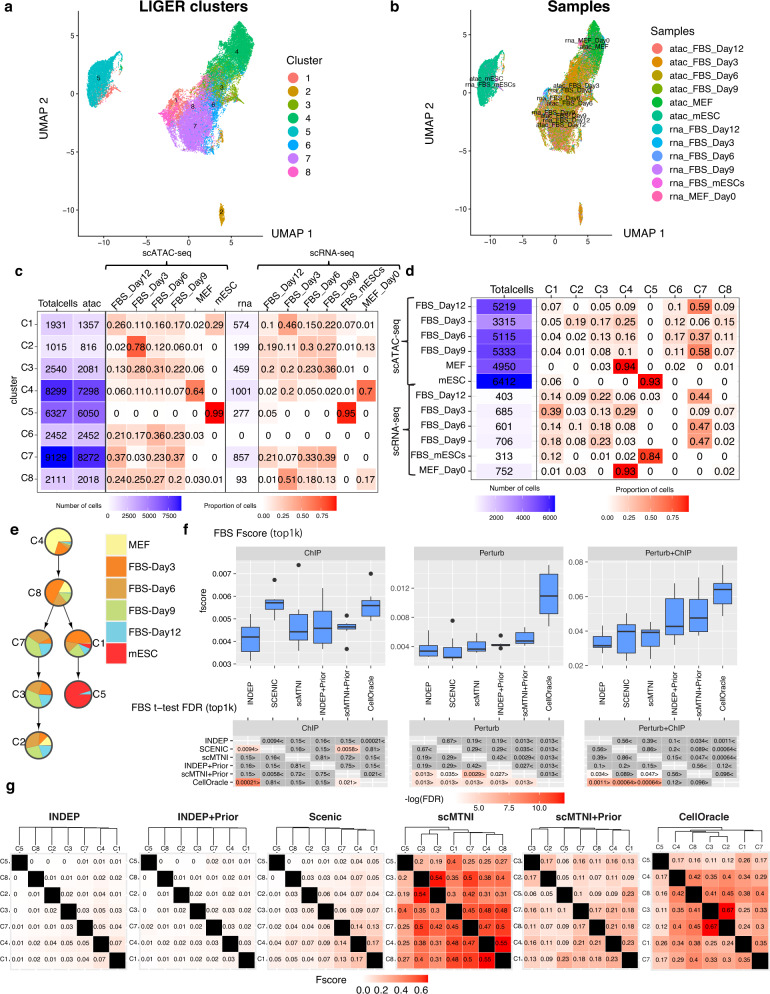
Fig. 3. Inference of cell-type specific networks of mouse cellular reprogramming data.
a UMAP of LIGER cell clusters on the scATAC-seq data and scRNA-seq data. b UMAP depicting the sample labels of the scATAC-seq and scRNA-seq data from mouse cellular reprogramming. c The distribution of samples in each LIGER cluster. d The distribution of LIGER clusters in each sample. e Inferred lineage structure for scMTNI linking the 7 cell clusters with scRNA-seq measurements. f F-score of top 1k edges in predicted networks of scMTNI, scMTNI+Prior, INDEP, INDEP+Prior, SCENIC and CellOracle compared to three gold standard datasets: ChIP, Perturb and Perturb+ChIP. The top boxplots show the F-scores of n = 7 cell clusters, while the bottom heatmaps show FDR corrected t-test comparing the F-scores of the row algorithm to that of the column algorithm. The two-sided paired t-test is conducted on F-scores of n = 7 cell clusters for every pair of algorithms. A FDR < 0.05 was considered significantly better. The sign < or > specifies whether the row algorithm’s F-scores were worse or better than the column algorithm’s F-scores. The color scale is specified by − log(FDR), with the red color proportional to significance. Non-significance is colored in gray. In the boxplot, the horizontal middle line of each plot is the median. The bounds of the box are 0.25 quantile (Q1) and 0.75 quantile (Q3). The upper whisker is the minimum of the maximum value and Q3 + 1.5*IQR, where IQR = Q3 − Q1. The lower whisker is the maximum of the minimum value and Q1 − 1.5*IQR. g Pairwise similarity of networks from each cell cluster using F-score on the top 4k edges. Rows and columns are ordered based on the dendrogram created using the F-score similarity. Source data are provided as a Source Data file.

