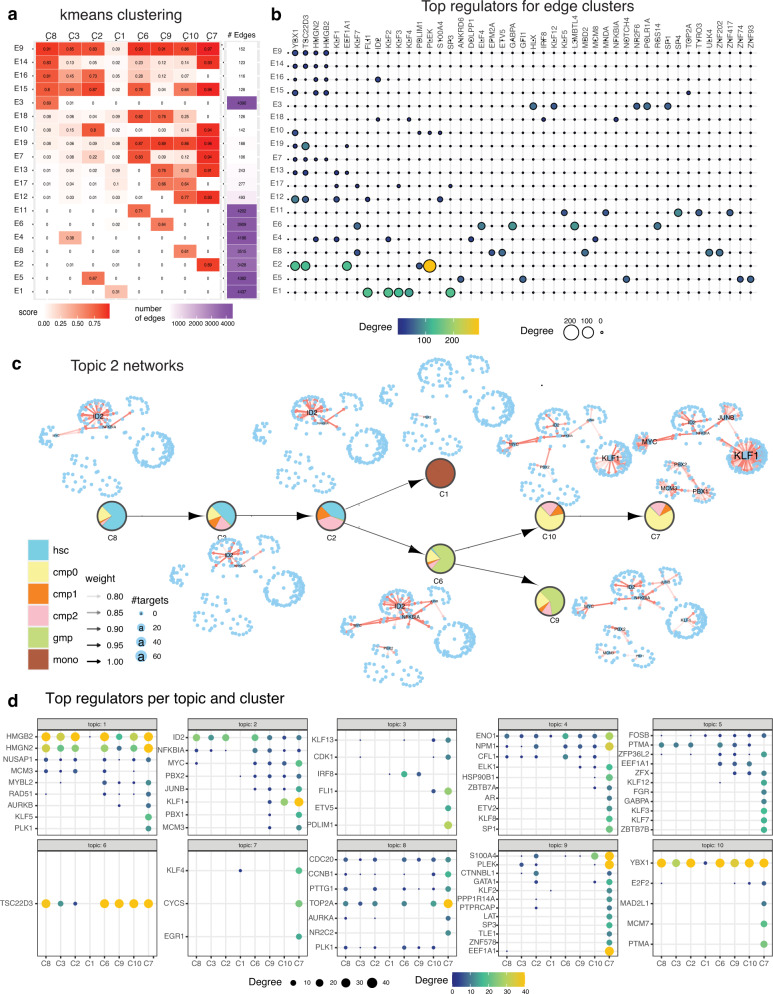
Fig. 6. Network rewiring during hematopoietic differentiation.
a k-means edge clusters of the top 5k edges (rows) across 8 cell clusters (columns). The edge confidence matrix was clustered into 19 clusters to identify common and divergent networks. The red intensity corresponds to the average confidence of edges in that cluster. Shown also are the number of edges in the edge cluster. b Top 5 regulators of each edge cluster. Shown are only regulators with at least 10 targets in a given edge cluster. The size and brightness (yellow) of the circle is proportional to the number of targets. c Topic-specific networks across each cell cluster for topic 2. The layout of each network is the same, edges present in a particular cell cluster are shown in red. Labeled nodes correspond to regulators with degree larger than 10. d Top regulators associated with each cell cluster’s network in each topic. Shown are only regulators that have at least 10 targets in any cell cluster. The more yellow and larger the circle, the greater are the number of targets for the regulator. Source data are provided as a Source Data file.

