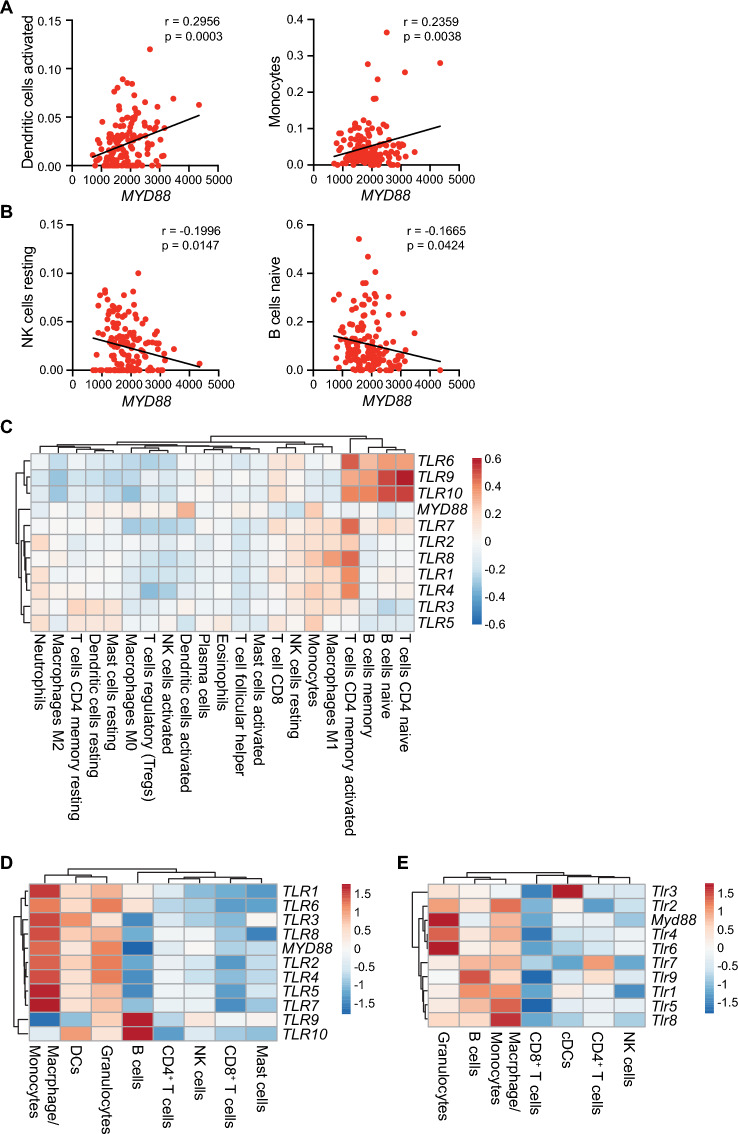
Figure 1.
MYD88 and TLR expression in human and murine pancreatic cancer. (A) Linear regression analysis showing positive (A) and negative (B) Pearson correlation between MYD88 expression and inferred presence of indicated immune subsets as estimated by CIBERSORT in the PAAD TCGA dataset (n = 149). (C) Heatmap showing linear regression analysis of TLR and MYD88 expression with presence of immune subsets as inferred by CIBERSORT in the PAAD TCGA dataset (n = 149). Positive Pearson correlations are indicated in shades of red, while negative correlations appear in blue. Data were visualized using ClustVis35. See Supplemental Fig. 1B for p values. (D) scRNAseq analysis on publicly available human PDAC samples34. Relative gene expression was assessed on PTPRC+ (CD45+) immune cells in PDAC, with non-immune cells excluded from analysis. Depicted are log2 fold change expression levels of indicated TLR genes and MYD88 in Itgam+Csf1r+CD68+ macrophages/monocytes; CD1A+, CD1B+, or CD1E+ DCs; CSF1R-CSF3R+ granulocytes; CD79A+ B cells; CD3E+CD4+ CD4+ T cells; CD3E-KLRC1+ NK cells; CD3E+CD8B+ CD8+ T cells; and CPA3+ mast cells. (E) scRNAseq was performed on CD45+ cells isolated from untreated PK5L1940 tumors in Myd88fl/fl mice (n = 4 mice). Depicted are log2 fold change expression levels of indicated Tlr genes and Myd88 in Itgam+Csf3r+Ly6c2− granulocytes, Cd79b+ B cells, Itgam+Csf1r+Adgre+ macrophages/monocytes, Cd3e+Cd8a+ CD8+ T cells, Zbtb46+ cDCs, Cd3e+Cd4+ CD4+ T cells, and Klrb1c+ NK cells. Significance in (A–C) was assessed by Pearson correlation, with p values as indicated in (A,B). See also Supplemental Fig. 1B.

