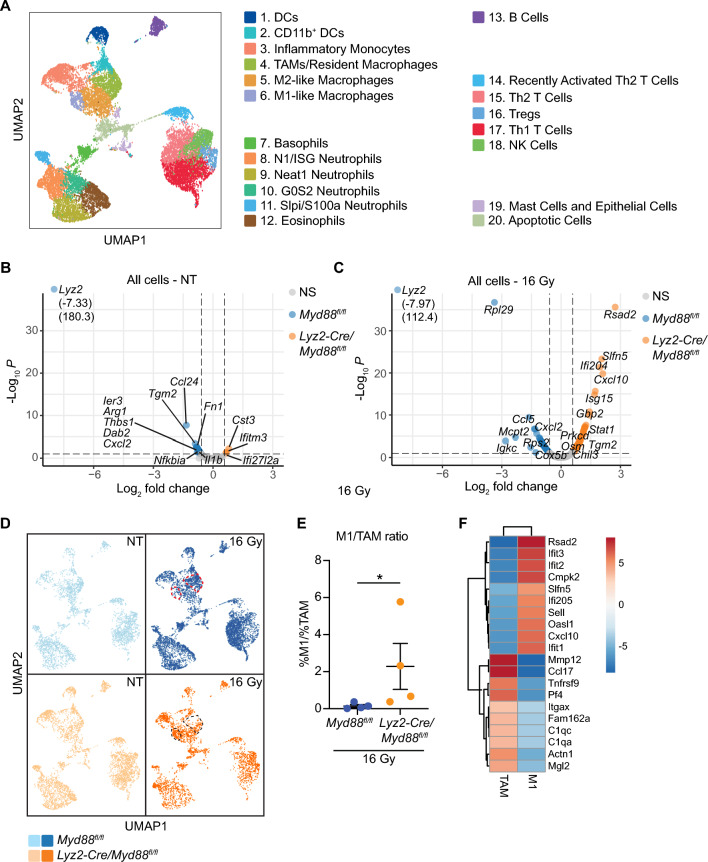
Figure 3.
scRNAseq in untreated and RT-treated tumors from Myd88fl/fl and Lyz2-Cre/Myd88fl/fl mice. scRNAseq was performed on CD45+ cells isolated from untreated tumors or 3d post-RT in Lyz2-Cre/Myd88fl/fl mice and Myd88fl/fl mice (n = 4 mice per group). (A) Cells were subjected to graph-based clustering using the Loupe Cell Browser, with the UMAP plot of unsupervised clustering shown. Dominant cell types within each cluster were identified using expression of known markers (see also Supplemental Fig. S3,S4). (B,C) Volcano plots representing a global view of differential gene expression in CD45+ cells that are upregulated in Lyz2-Cre/Myd88fl/fl mice (right, orange) or upregulated in Myd88fl/fl mice (left, blue) in untreated mice (B) or mice treated with 16 Gy RT (C). (D) UMAPs were split according to genotype and treatment, with cells from Lyz2-Cre/Myd88fl/fl mice identified in orange and Myd88fl/fl mice identified in blue. Untreated mice are depicted in the lighter shade, while mice treated with 16 Gy RT are shown in the darker shade. TAM and M1 macrophage clusters are circled in either red or black in 16 Gy treated mice. (E) Graph depicting the ratio of M1:TAM populations as a percentage of total immune cells in Lyz2-Cre/Myd88fl/fl mice treated with 16 Gy compared to Myd88fl/fl mice treated with 16 Gy. (F) Top 10 genes upregulated in M1 and TAM populations. Significance of differential gene expression in (B,C) was defined as fold change > 1.5 and p < 0.1. Significance in (E) was determined by Mann–Whitney test, * p < 0.05.

