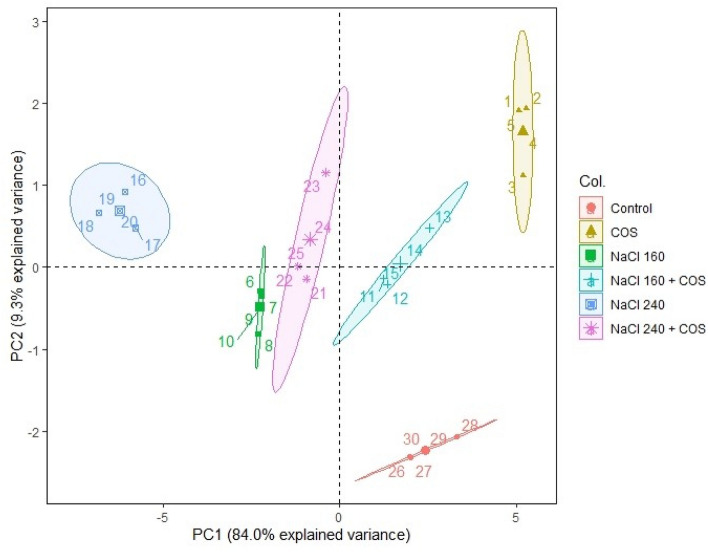
Figure 8.
The scatter plot of PCA shows the correlation among each treatment group. The absence of overlapping clusters suggests a significant (α = 0.05) difference among treatment-induced modulations. Ellipses represent a confidence level of 95%. COS, chitosan oligomers 120 mg L−1; NaCl concentrations are represented in mM. The numbers illustrate the replicates of the particular treatment i.e., each treatment group consisted of 5 such replicates (n = 5).

