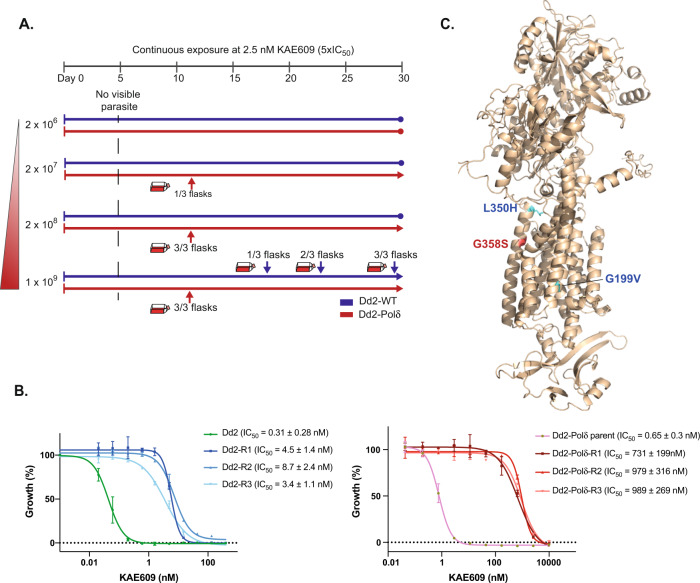
Fig. 3. Efficient selection of resistance to KAE609 using the DNA polymerase δ mutant parasite.
A Dd2-WT (blue line) and Dd2-Polδ (red line) were continuously cultured in the presence of 2.5 nM KAE609 (5 × IC50). Parasite inocula ranged from 2 × 10⁶ to 1 × 10⁹ cells, in triplicate flasks, and parasites were detected by microscopy over the 30-day selection period. Dd2-Polδ parasites were observed on day 12 with the starting inoculum of 2 × 10⁷, 2 × 10⁸ and 1 × 10⁹, whereas Dd2-WT parasites were only detected with the 109 inoculum, appearing in three flasks on day 18, 21 and 30, respectively. B Dose-response curves of KAE609 for parental lines not exposed to drug pressure and drug-selected lines (R1-R3) for Dd2-WT (left panel) and Dd2-Polδ (right panel). Shown is a representative assay (with two technical replicates, error bars showing SD), with IC50 values represented as mean +/−SD derived from the following biological replicates (Dd2-WT, n = 6; Dd2-R1, n = 3; Dd2-R2, n = 3; Dd2-R3, n = 3; DNA-Polδ, n = 6; Polδ-R1, n = 6; Polδ-R2, n = 6; Polδ-R3, n = 5). C AlphaFold model of PfATP4 showing KAE609 resistance mutations located in or near the transmembrane domains. Blue residues originated from Dd2-WT selections, red from Dd2-Polδ. Source data are provided as a Source Data file.

