Figure 2.

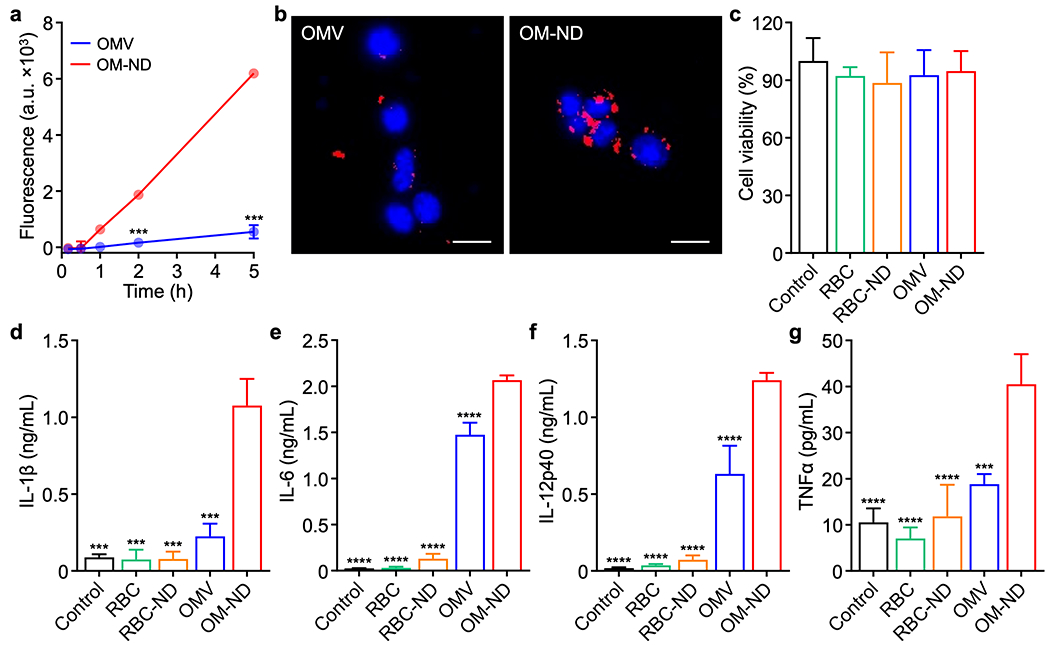
In vitro uptake and immune stimulation. (a) Uptake of dye-labeled free OMVs and OM-NDs by DC2.4 cells over time (n = 3, mean ± SD). (b) Fluorescence visualization of free OMV (left) and OM-ND (right) uptake after 3 h of incubation with DC2.4 cells (scale bars: 20 μm; red: bacterial membrane, blue: nuclei). (c) Viability of DC2.4 cells after 2 days of incubation with OM-NDs or various control samples (n = 3, mean + SD). (d-g) Concentration of IL-1β (d), IL-6 (e), IL-12p40 (f), and TNFα (g) secreted by DC2.4 after 2 days of incubation with OM-NDs or control samples (n = 3, mean + SD). ***p < 0.001 and ****p < 0.0001 (compared to OM-ND); Student’s t-test (a) or one-way ANOVA (d-g).
