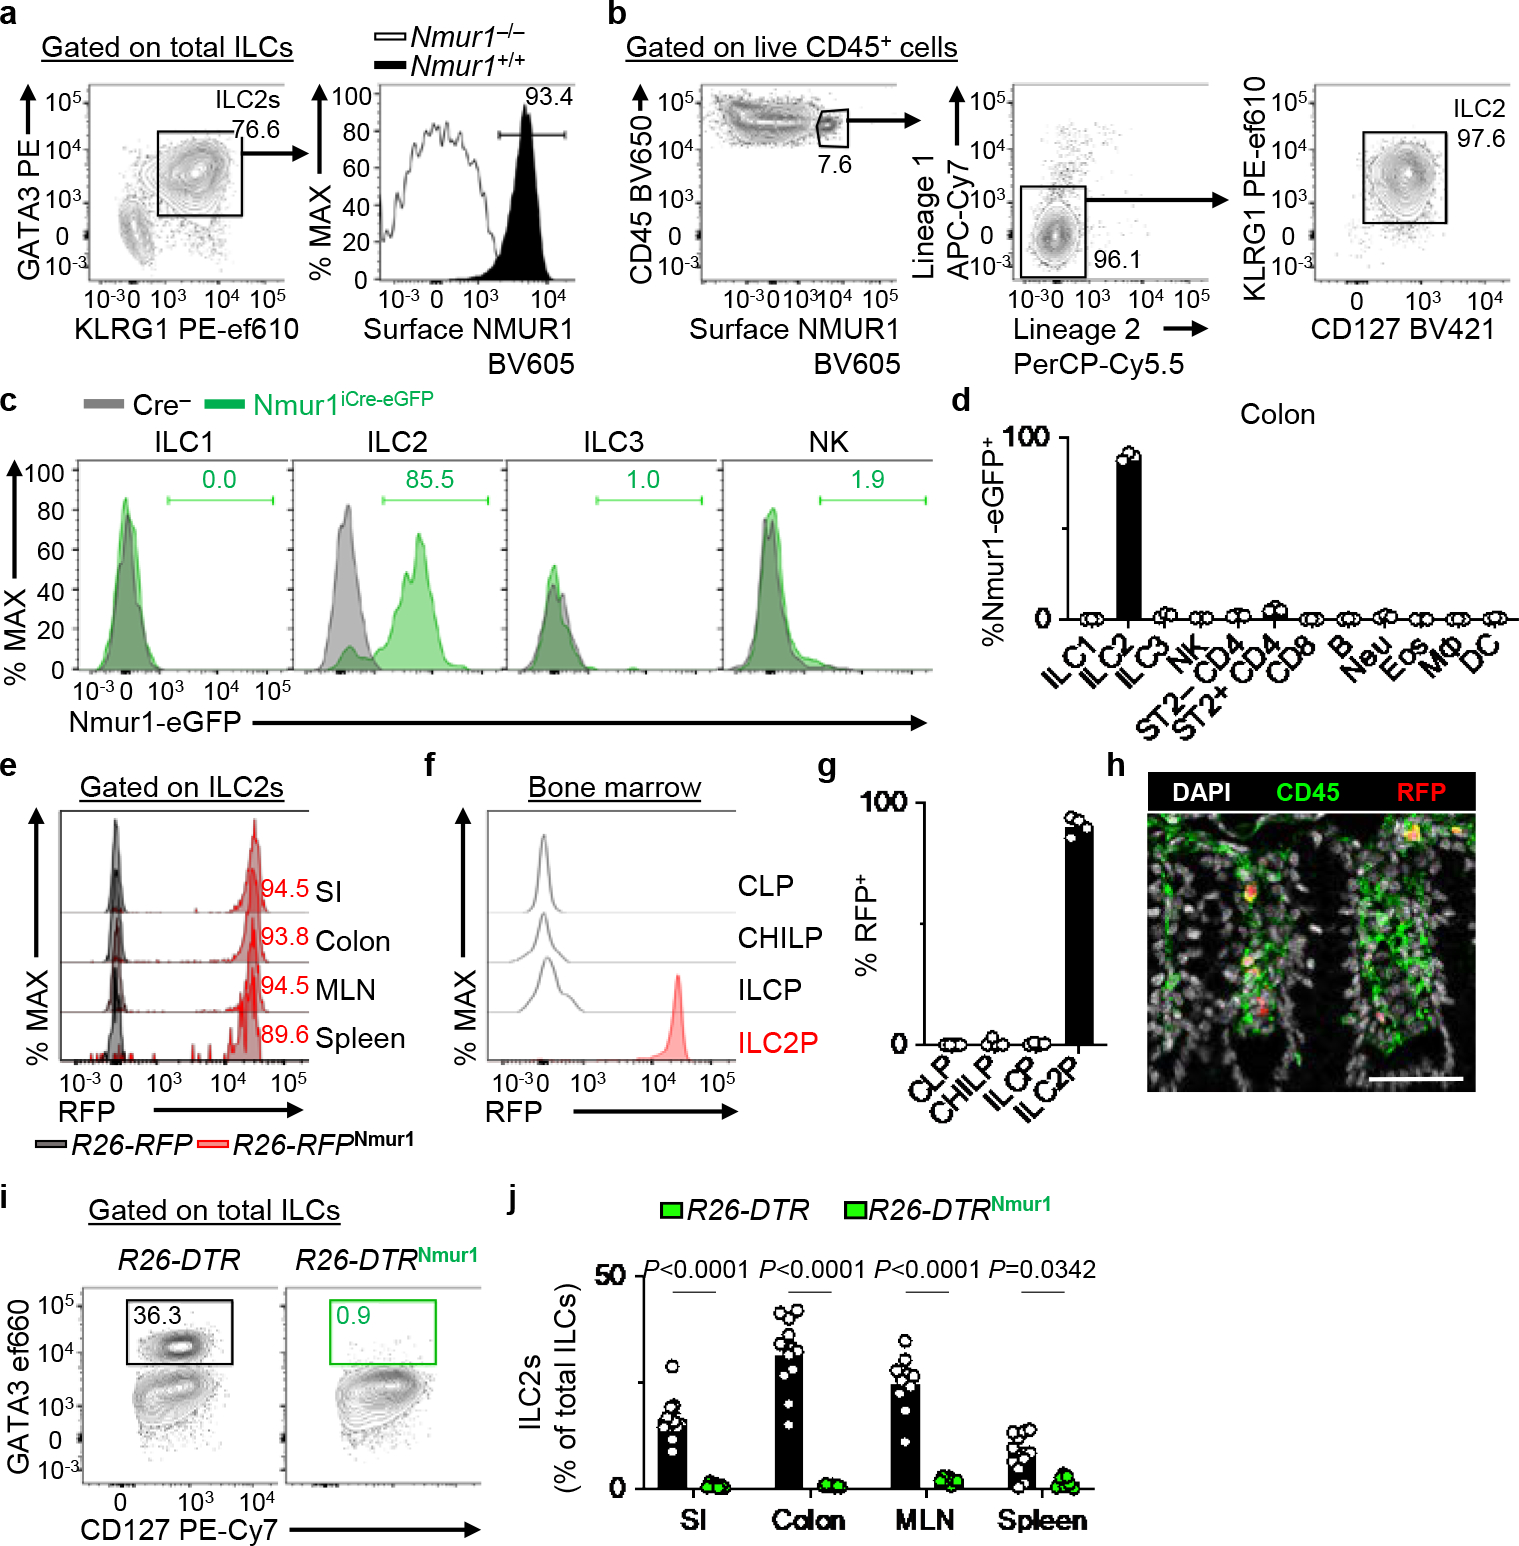
Figure 1 |. Novel mouse strain for efficient targeting of group 2 innate lymphoid cells.

a, Representative flow cytometry and histogram showing NMUR1 protein expression in colon ILC2s from Nmur1+/+ and Nmur1−/− mice. Total ILCs gated as live CD45+Lin−CD90+CD127+ events (Lin: CD3ε, CD5, CD11b, CD11c, FcεRI, B220). b, Representative flow cytometry analysis of NMUR1+ cells within colonic lamina propria lymphocytes (LPL) isolated from naïve WT mice as measured by surface protein staining (Lineage 1: CD11b, CD11c, FcεRI, B220. Lineage 2: CD3ε, CD5). c, d, Nmur1-eGFP expression in ILCs from Nmur1iCre-eGFP mice (n=3 mice). Representative overlaid histograms depicting Nmur1-eGFP expression in ILCs (c) and percentages of Nmur1-eGFP+ cells within the indicated immune cell subsets isolated from the colon (d). e, Representative overlaid histograms showing iCre (RFP) expression in ILC2s from the indicated tissues of R26-RFPNmur1 mice. Histograms are representative of two independent experiments. f, g, Expression of iCre (RFP) in the indicated progenitor cells isolated from the bone marrow of R26-RFPNmur1 mice (n=4 mice). Representative histograms (f) and percentages of RFP+ cells within indicated progenitor cells (g). h, Representative image of colon from R26-RFPNmur1 mice (two independent experiments). DAPI (white), CD45 (green), RFP (red) (bar=50 μm). i, j, R26-DTR (n=11 mice) and R26-DTRNmur1 (n=7 mice) received 2 daily injections of diphtheria toxin followed by 2 days of rest. Representative flow cytometry analysis of ILC2s in the colon pre-gated on total ILCs (i) and percentages of ILC2s in the indicated tissues (j). Data in d are representative of two independent experiments. Data in g are pooled from two independent experiments. Data in j are pooled from three independent experiments. Two-way ANOVA with Šídák multiple comparisons test (j). P values are presented where appropriate. Data are represented as means ± S.E.M. Neu=neutrophils, Eos=eosinophils, MΦ=macrophages, DC=dendritic cells.
