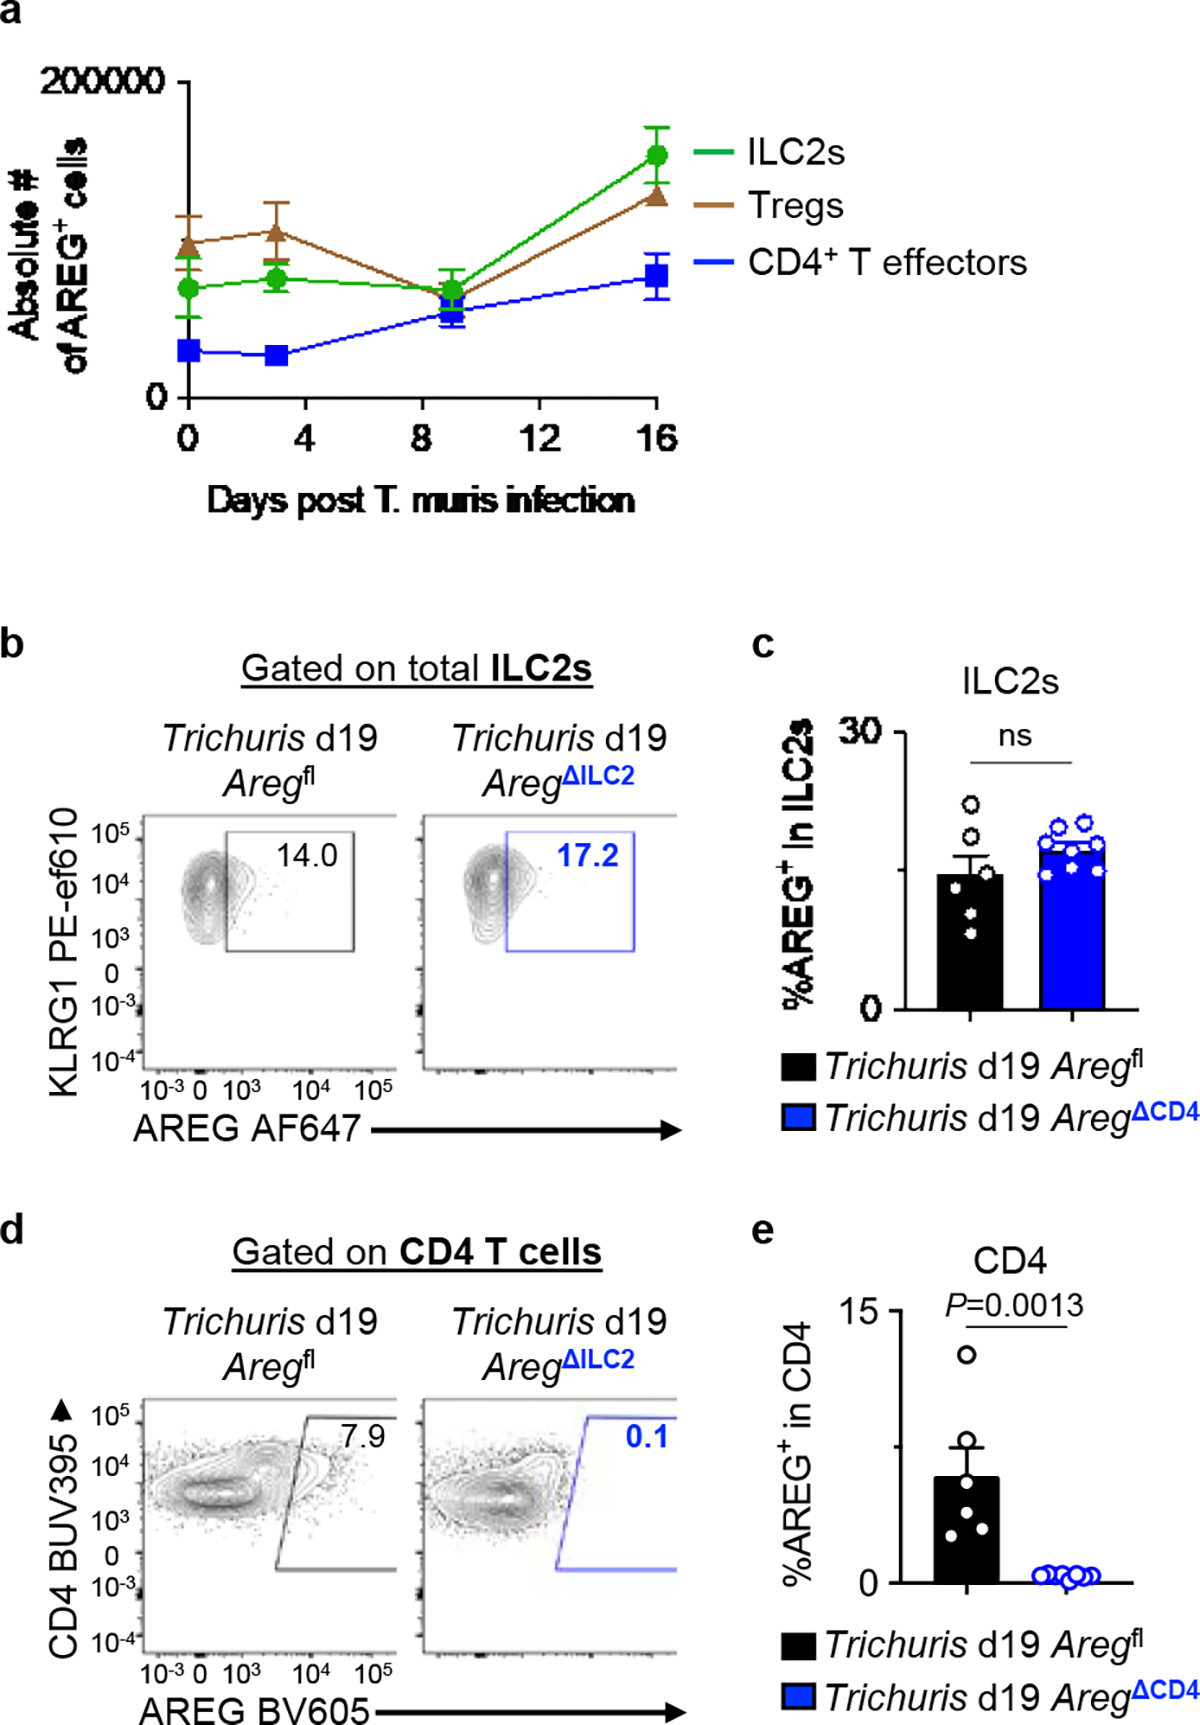
Extended Data Figure 7 |. Specific and efficient deletion of Areg within T cells in AregΔCD4 mice.

a, WT mice were infected with 200 Trichuris eggs by oral gavage, and the cecum was analyzed by flow cytometry for AREG+ cells among ILC2s, Foxp3+ Tregs and Foxp3− CD4+ T effectors at day 0 (n=6 mice), day 3 (n=9 mice), day 9 (n=5 mice), and day 16 (n=4 mice) post-infection. b-e, Aregfl (n=6 mice) and AregΔCD4 (n=8 mice) were infected with 200 Trichuris eggs by oral gavage and analyzed 19 days post-infection. Representative flow cytometry analysis of ILC2s (b) and CD4+ T cells (d) for AREG+ cells. Percentage of AREG-producing cells within ILC2s (c) and CD4+ T cells (e). Data in a are pooled from two independent experiments. Data in c and e are representative of two independent experiments. Unpaired two-sided t-test (c, e). P values are presented where appropriate. ns, not significant. Data are represented as means ± S.E.M.
