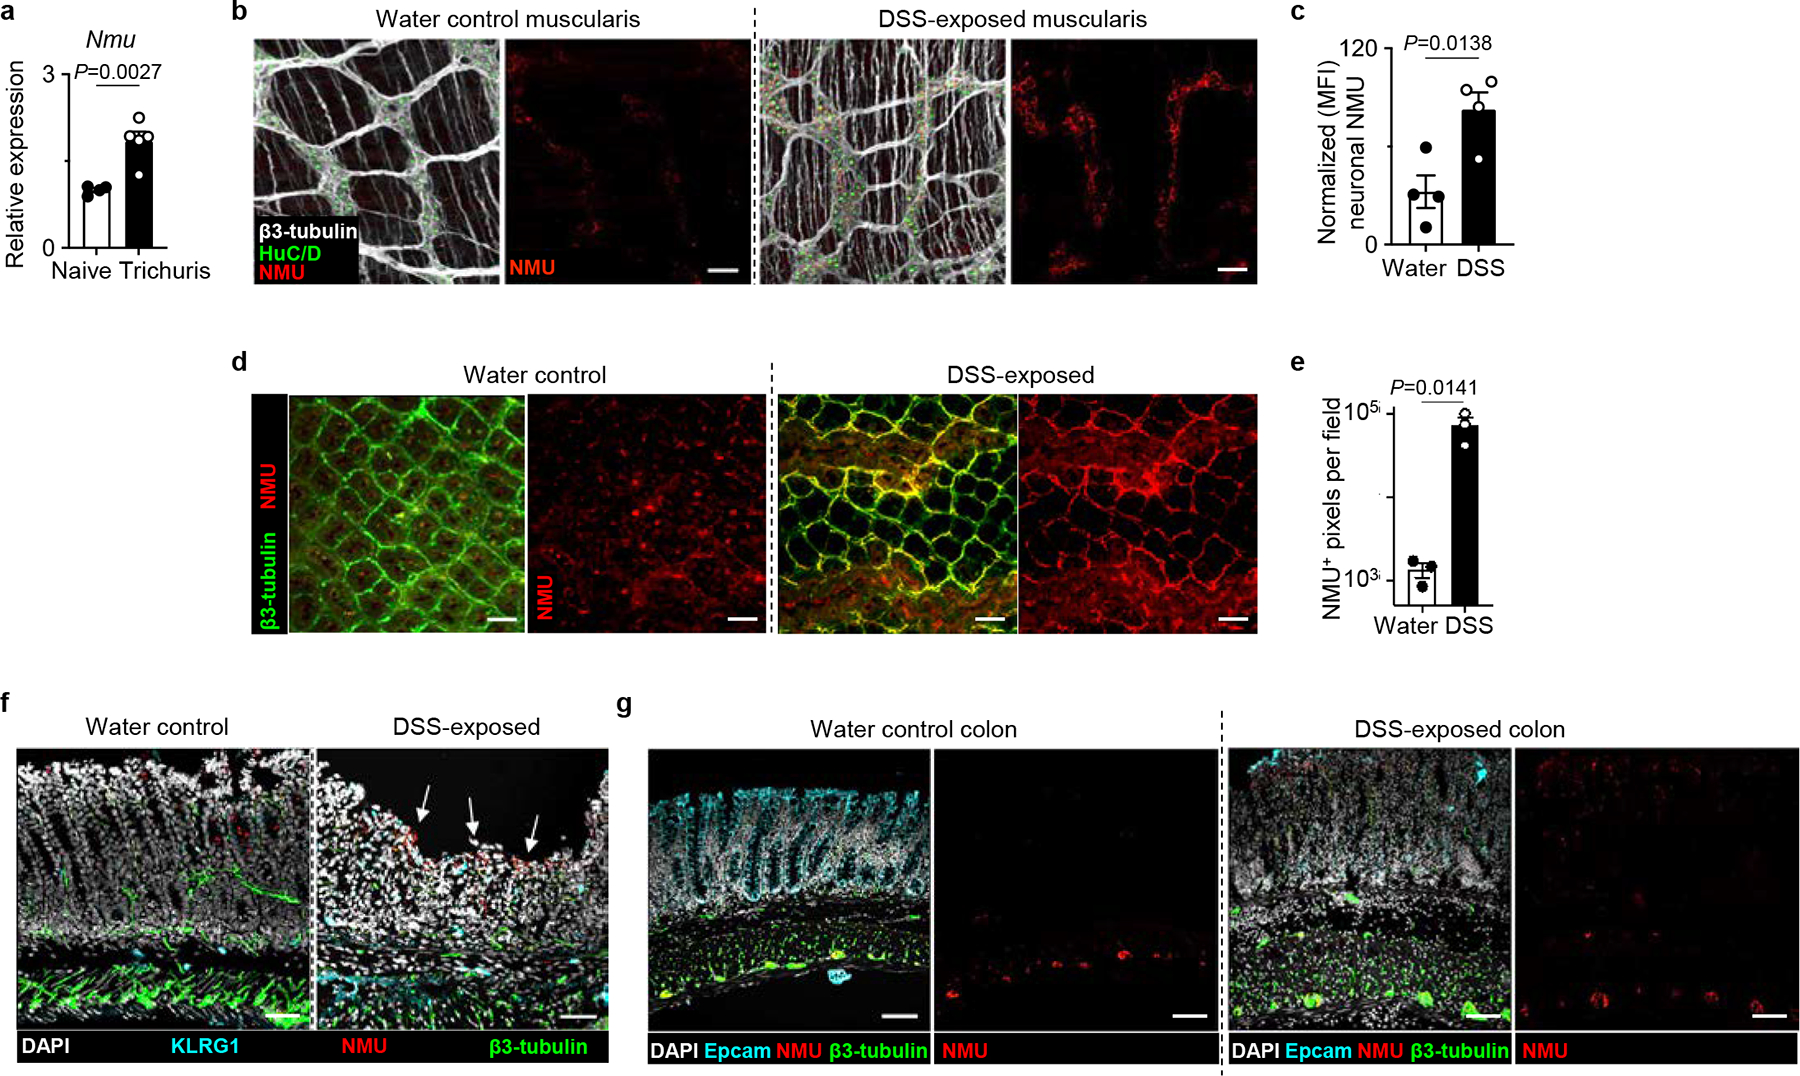
Extended Data Figure 9 |. Neuronal production of NMU is upregulated in the context of intestinal inflammation.

a, Nmu expression in the proximal colon of naïve (n=4 mice) or Trichuris-infected (n=5 mice) determined by qRT-PCR. Normalized to Actb housekeeping gene. b, c Muscularis propria of naïve water control (n=4 mice) or DSS-exposed inflamed colons (n=4) mice from WT mice were stained for β3-tubulin (white), HuC/D (green), and NMU protein (red). Representative images (bars=50 μm) (b). Neuronal NMU intensity was quantified by normalizing fluorescent intensity of NMU staining to the number of HuC/D+ nuclei in two fields per sample (c). d, e, CUBIC imaging of naïve water control (n=3 mice) or DSS-exposed (n=3 mice) colon from WT mice stained for β3-tubulin (green) and NMU protein (red). Representative images (bars=50 μm) (d) and quantification of NMU+ pixels (e). f, Representative images of swiss rolls of naïve water or DSS-exposed colons stained for DAPI (white), KLRG1 (cyan), NMU (red) and β3-tubulin (green) (bars=50 μm). Arrows depicting increased NMU staining in DSS-exposed colons. Images are representative of two independent experiments. g, Representative images of swiss rolls of naïve water or DSS-exposed condition colons stained for DAPI (white), Epcam (cyan), NMU (red) and β3-tubulin (green) (bars=50 μm). Images are representative of two independent experiments. Data in a and e are representative of two independent experiments. Data in c are pooled from two independent experiments. Unpaired two-sided t-test (a, c, e). P values are presented where appropriate. Data are represented as means ± S.E.M.
