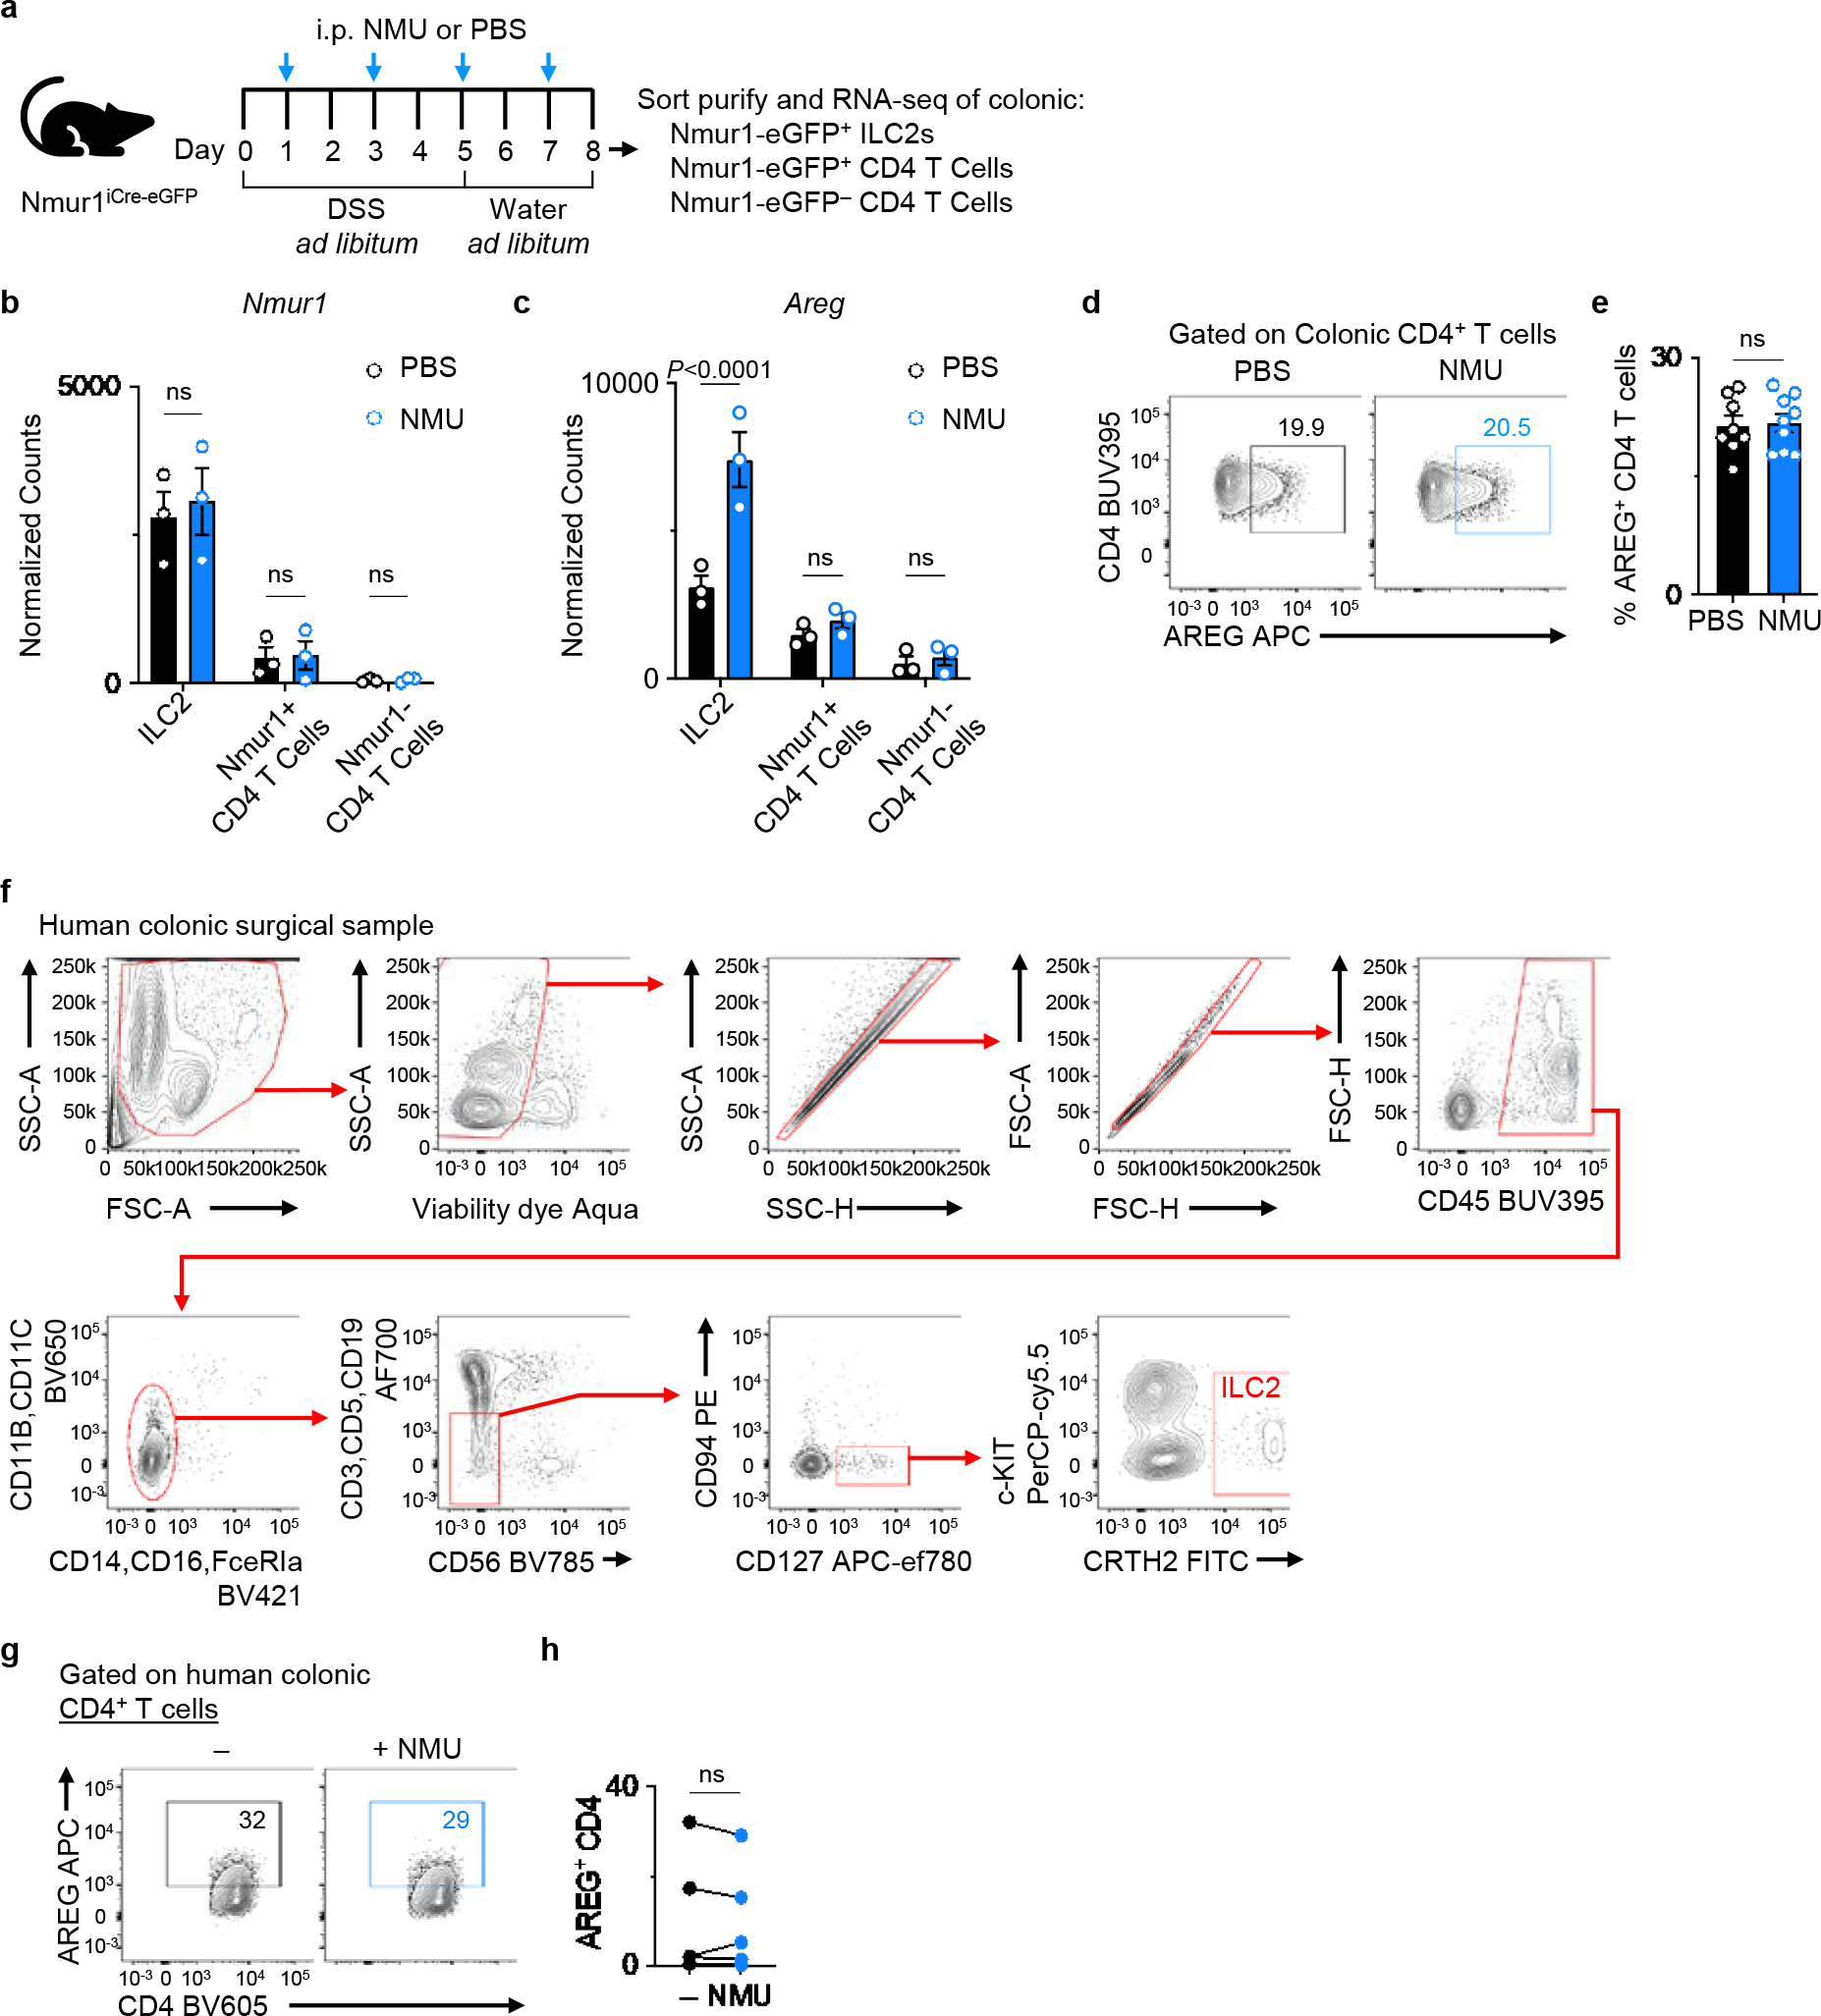
Extended Data Figure 10 |. NMU promotes AREG expression in ILC2s in both mice and humans.

a, Experimental schematic of RNA sequencing (RNA-seq) analysis of ILC2s and CD4+ T cells in the context of intestinal inflammation. Nmur1-eGFP+ ILC2s, Nmur1-eGFP+ CD4+ T cells and Nmur1-eGFP− CD4+ T cells were sort-purified from colonic LPLs (n=3 three independent cohorts) and subjected to bulk RNA-seq. b, c, mRNA expression levels of Nmur1 (b) and Areg (c) as determined by comparing the normalized read counts of each gene. d, e, Representative flow cytometry analysis of AREG+ CD4+ T cells (d) and percentage of AREG+ CD4+ T cells (e) in the colons of WT mice injected with PBS (n=8 mice) or NMU (n=9 mice). f, Gating strategy for analyzing human colonic LPLs isolated from surgical biopsy samples from ulcerative colitis (UC) patients. g, h, AREG production by human CD4+ T cells after stimulation of human colonic LPLs from UC patients with or without NMU in vitro overnight. Representative flow cytometry analysis of human CD4+ T cells (g). Percentage of AREG+ CD4+ T cells (n=5 donors) (h). Data in b, c represent sequenced data from three independent biological replicates. Data in e are pooled from two independent experiments. Data in h contain 5 independent human samples, with each dot representing an individual donor. Two-way ANOVA with Šídák multiple comparisons test (b, c). Unpaired two-sided t-test (e). Paired two-sided t-test (h). P values are presented where appropriate. ns, not significant. Data are represented as means ± S.E.M.
