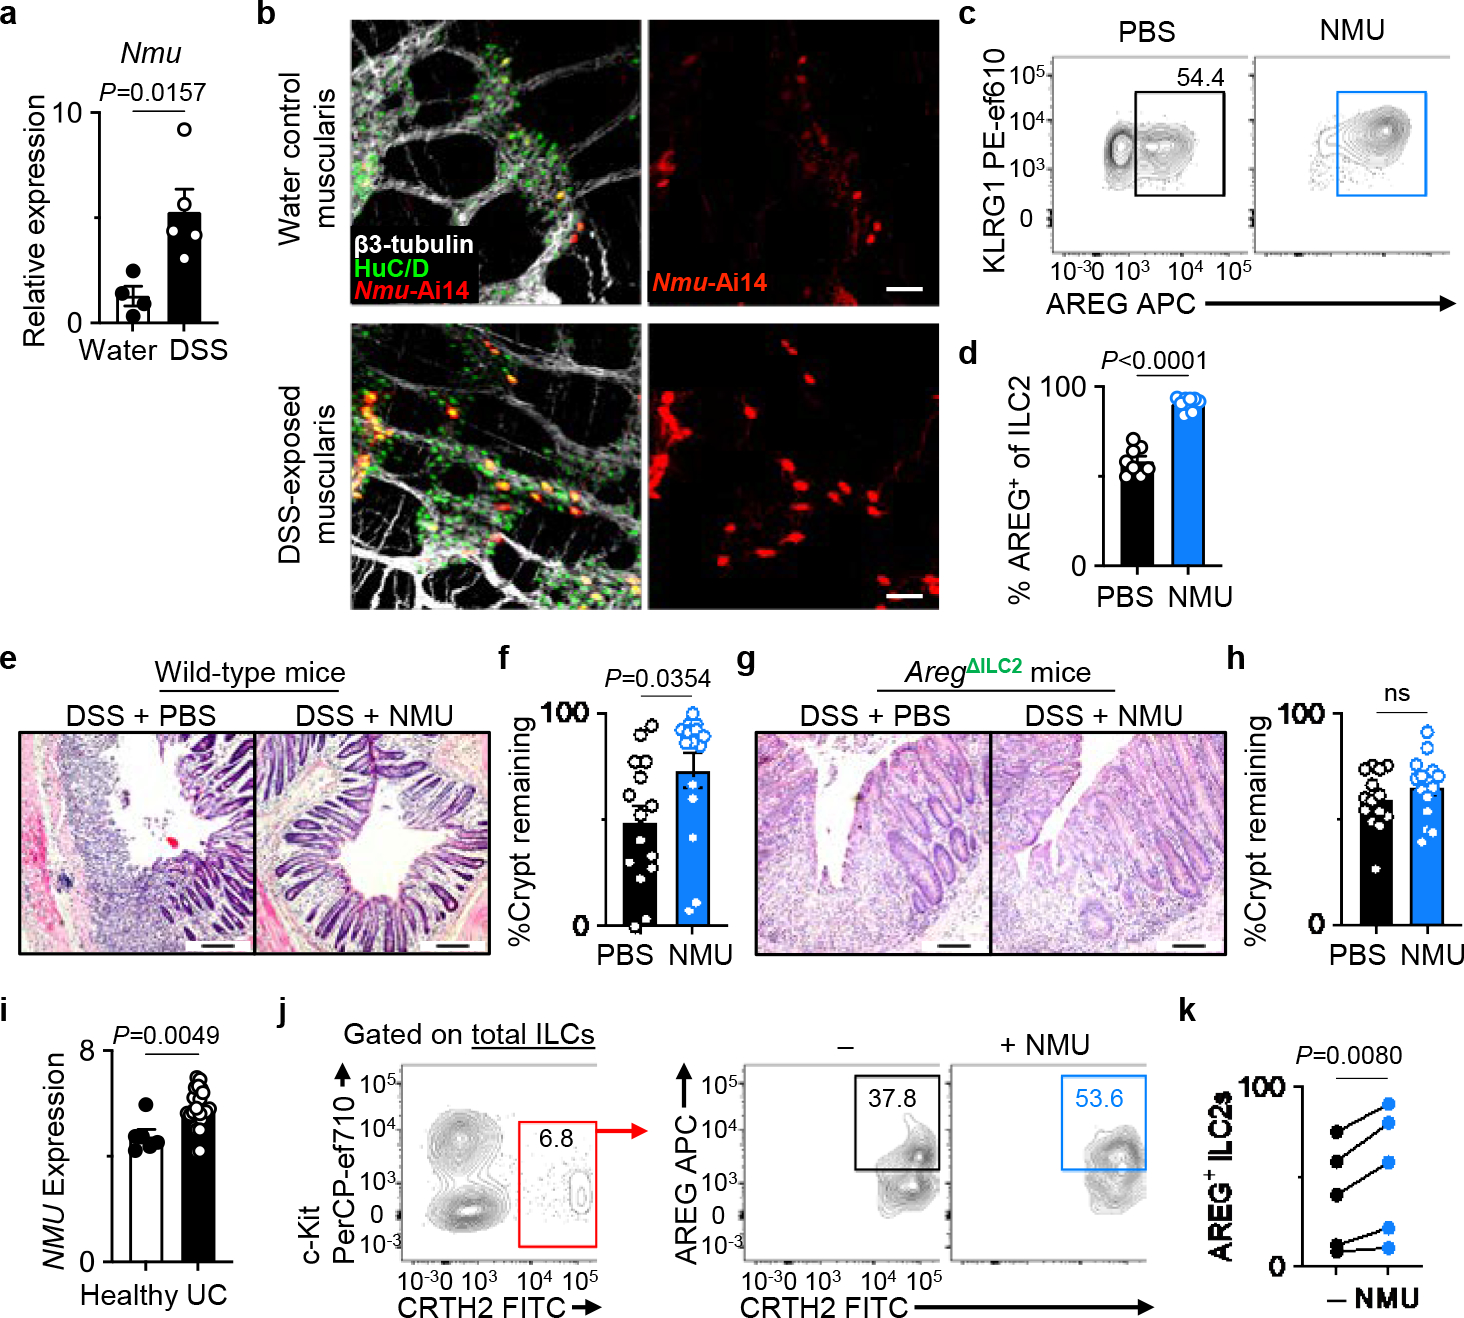
Figure 4 |. NMU mediates the non-redundant tissue-protective functions of ILC2-derived AREG.

a, Nmu expression in the naïve (n=4 mice) and DSS-exposed (n=5 mice) distal colons determined by qRT-PCR. Normalized to Actb housekeeping gene. b, Representative images of the muscularis propria of naïve (n=3 mice) or DSS-exposed (n=3 mice) inflamed colons of Ai14Nmu mice (bars=50 μm). β3-tubulin (white), HuC/D (green). c, d, Induction of AREG+ ILC2s with NMU in vivo. Representative flow cytometry analysis of ILC2s (c) and percentages of AREG+ ILC2s (d) in the colons of WT mice injected with PBS (n=8 mice) or NMU (n=9 mice) analyzed 18 hours post-injection. e-h, Colonic epithelial crypt architecture analyzed by H&E staining (bars=100 μm). DSS-exposed wild-type mice treated with PBS (n=15 mice) or NMU (n=15 mice) (e, f). DSS-exposed AregΔILC2 mice treated with PBS (n=14 mice) or NMU (n=15 mice) (g, h). i, NMU expression in the human intestinal biopsies (E-GEOD-14580) from healthy (n=6 donors) or UC patients (n=24 donors) as determined by microarray analysis. j, k, Representative flow cytometry analysis of human ILC2s (j) and percentages of AREG+ human ILC2s (k) after stimulation of LPLs isolated from freshly collected surgical colonic and ileal biopsies from IBD patients with or without NMU in vitro (n=5 donors). Each dot represents individual donors assessed in independent experiments. Gating strategy is shown in Extended Data Fig. 10f. Data in a are representative of two independent experiments. Data in d are pooled from two independent experiments. Data in f and h are pooled from three independent experiments. Data in k contain 5 independent human samples, with each dot representing an individual donor. Unpaired two-sided t-test (a, d, f, h, i). Paired two-sided t-test (k). P values are presented where appropriate. ns, not significant. Data are represented as means ± S.E.M. IBD – inflammatory bowel diseases.
