
Extended Data Figure 1 |. Nmur1-eGFP is highly expressed and enriched in ILC2s in lymphoid and non-lymphoid tissues.
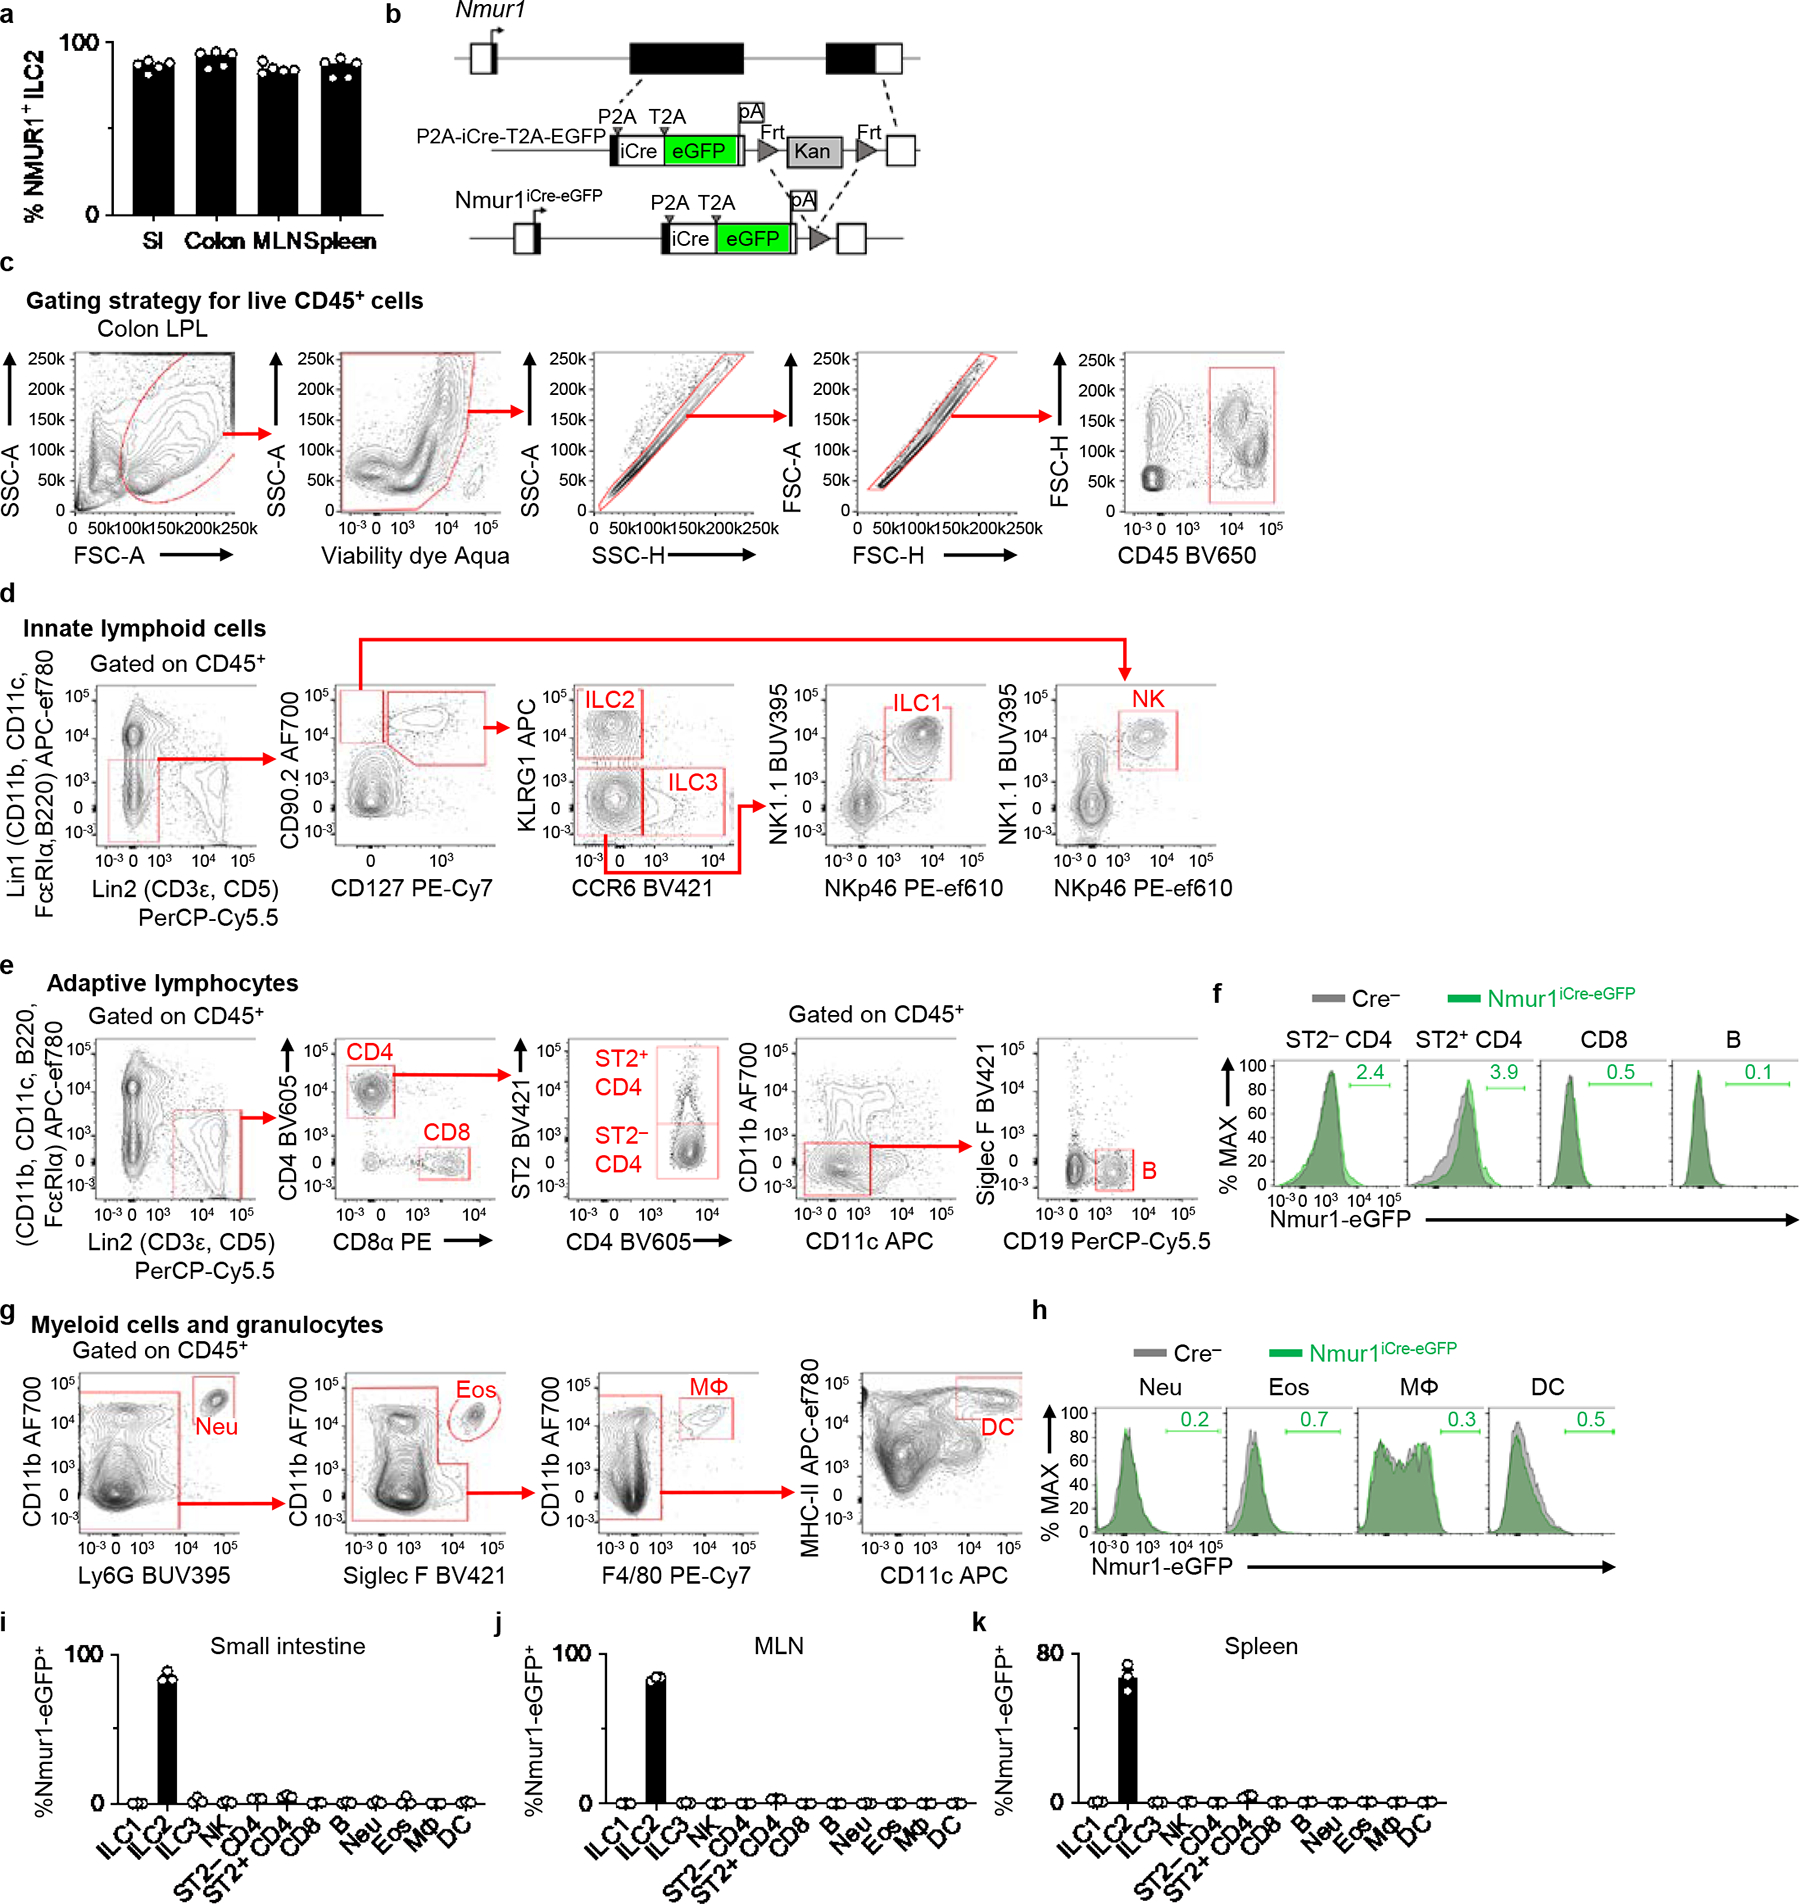
a, Percentages of surface NMUR1+ ILC2s isolated from the indicated tissues from Nmur1+/+ WT mice (n=5 mice). b, Schematic of targeting construct for generating Nmur1iCre-eGFP mice. c-k, Comprehensive analysis of Nmur1-eGFP expression in Nmur1iCre-eGFP mice. Representative gating strategy for live CD45+ cells (c), innate lymphoid cell (ILC) subsets (d), adaptive lymphocytes (e), and myeloid cells and granulocytes (g). Representative overlaid histograms depicting Nmur1-eGFP expression in adaptive lymphocytes (f) and myeloid cells and granulocytes (h) from Nmur1iCre-eGFP mice and Cre-negative littermate controls. Percentages of Nmur1-eGFP+ cells within the indicated immune cell subsets isolated from small intestines (i), mesenteric lymph nodes (MLN) (j), and spleens (k) of Nmur1iCre-eGFP mice (n=3 mice). Data in a and i-k are representative of two independent experiments. Data are represented as means ± S.E.M.