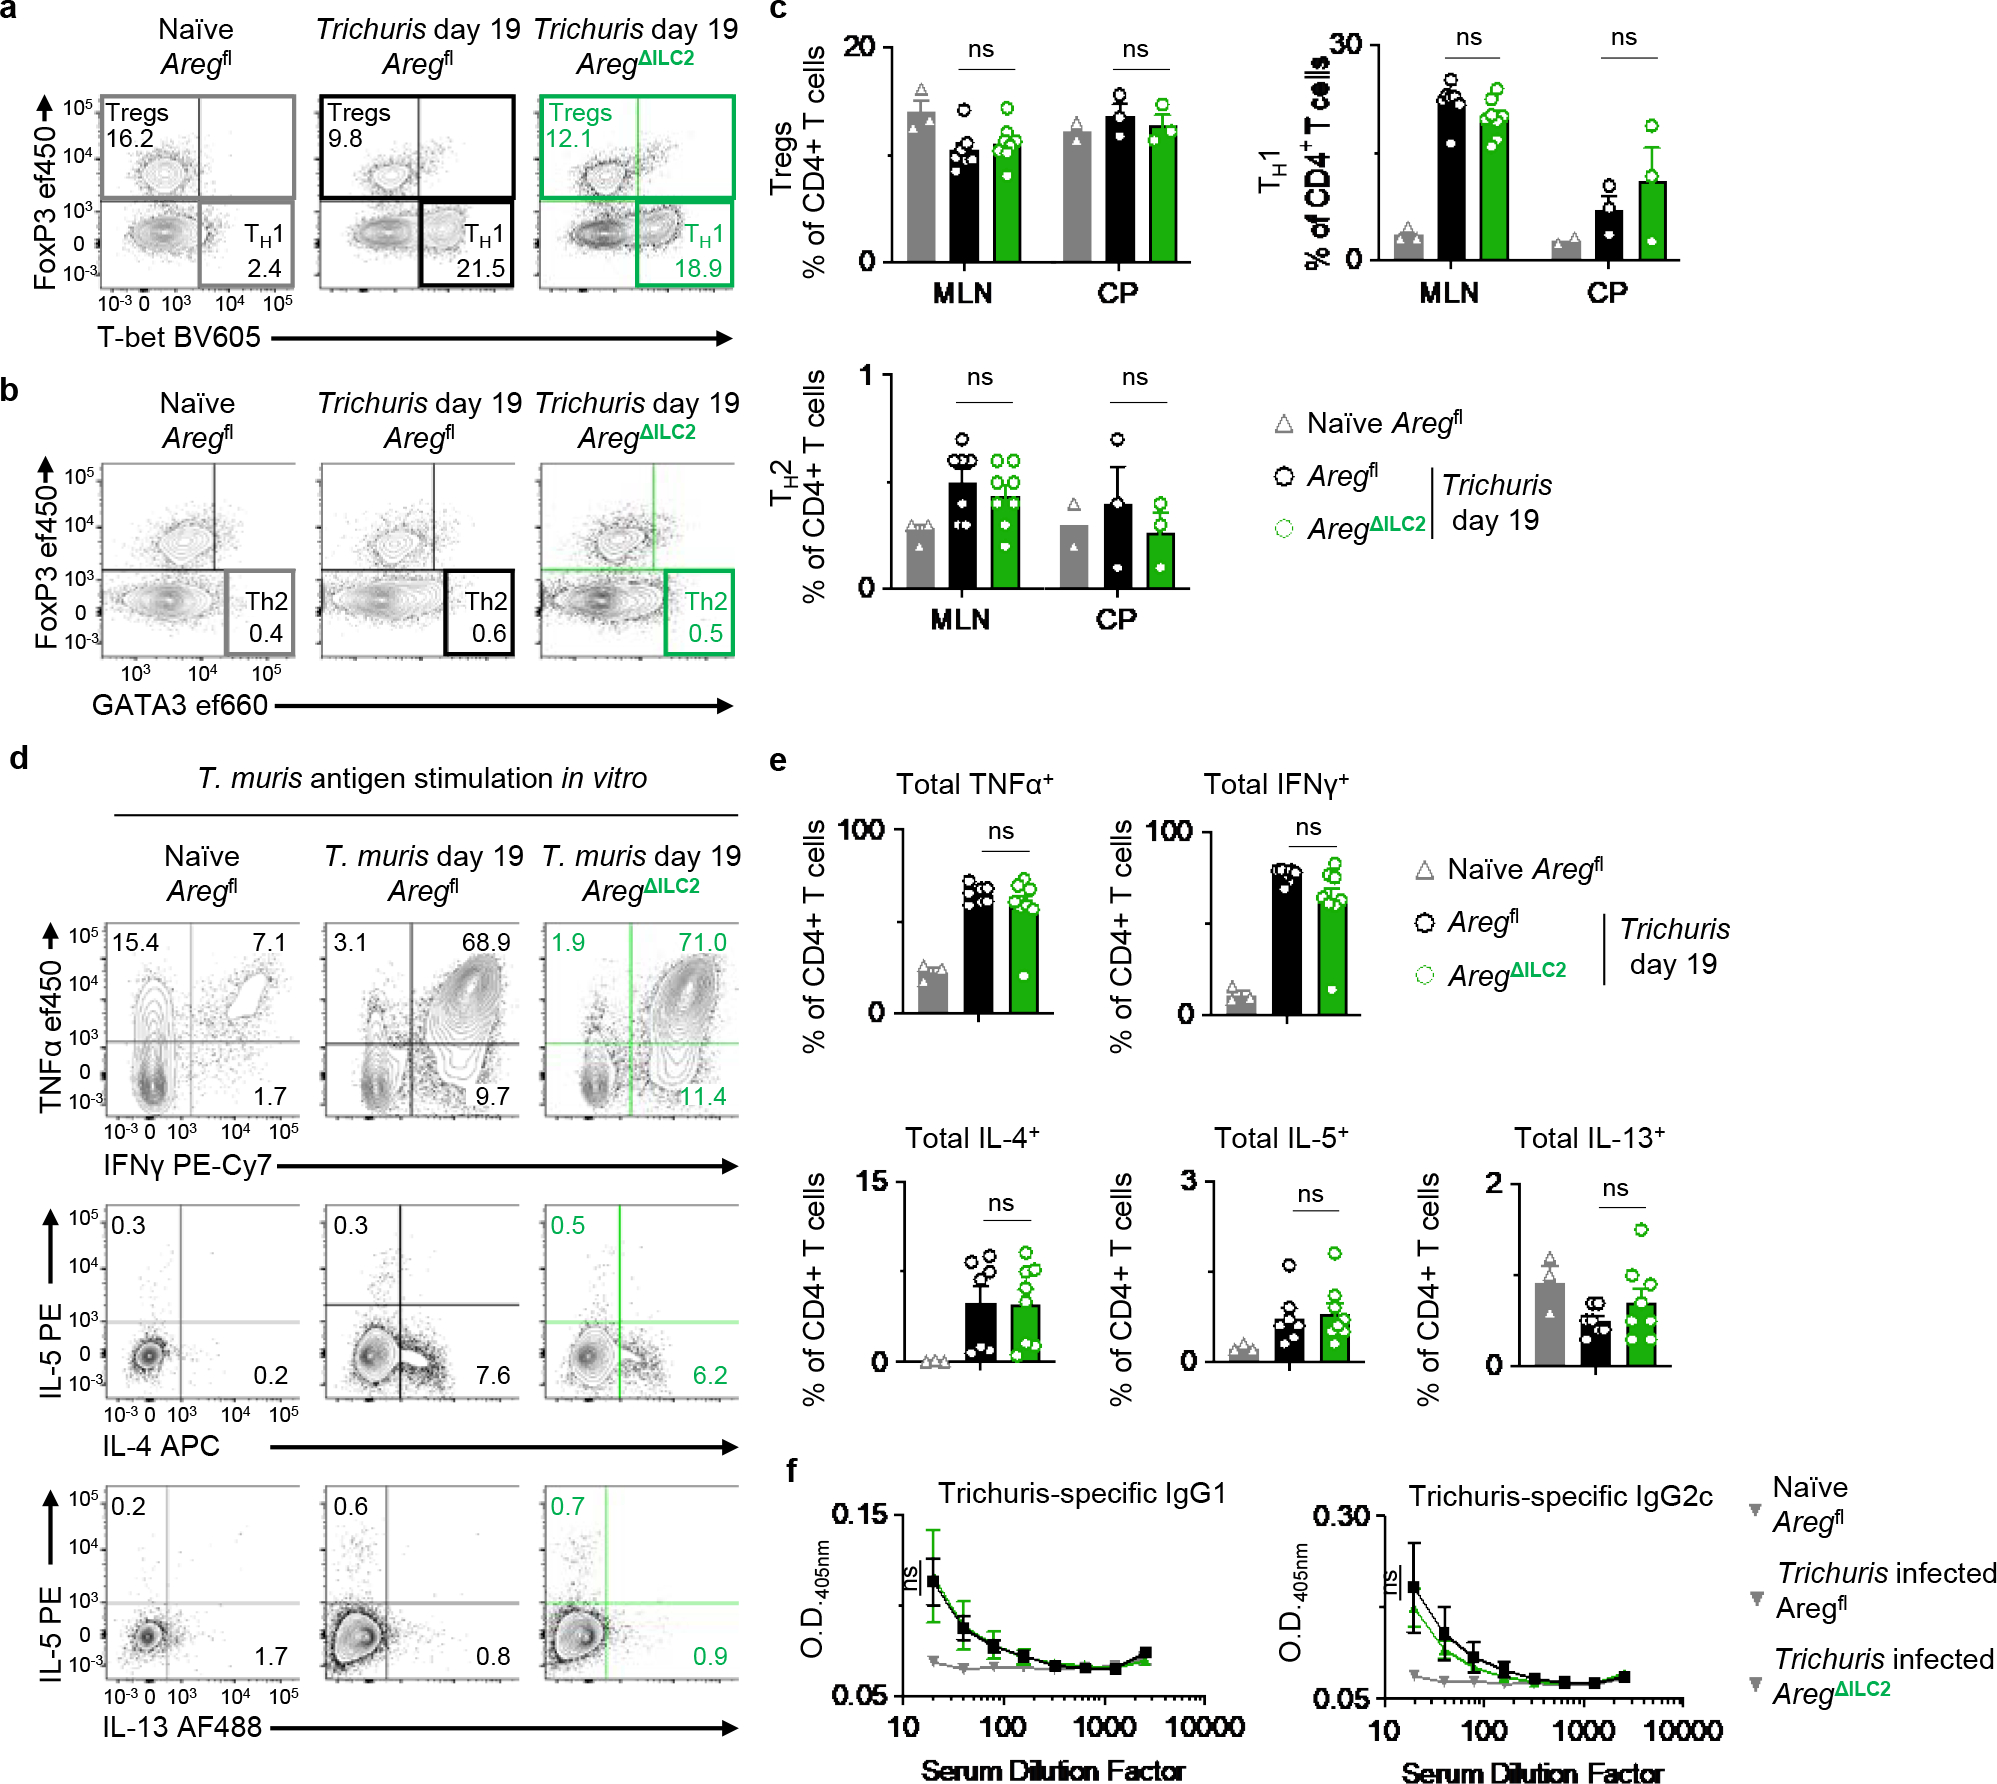
Extended Data Figure 5 |. Deletion of ILC2-derived AREG does not impact the priming of adaptive immune responses.

a-e, Analysis of MLN isolated from naïve Aregfl (n=3 mice) and Trichuris-infected Aregfl (n=7 mice) and AregΔILC2 (n=8 mice) at day 19 post-infection. Cecal patches (CP) were pooled as one sample when necessary due to cell yield for flow cytometry analysis (Aregfl (n=2 pooled CP) and Trichuris-infected Aregfl (n=3 pooled CP) and AregΔILC2 (n=3 pooled CP)). Representative flow cytometry analysis of CD4+ T cell subsets (a, b) and percentages of Foxp3+ Tregs, T-bet+ Th1 and GATA3+ Th2 CD4+ T cells (c). Representative flow cytometry analysis of pathogen-specific cytokine production in MLN CD4+ T cells after stimulation with Trichuris antigen for 3 days ex vivo (d). Percentage of CD4+ T cells producing TNFα, IFNγ, IL-4, IL-5, and IL-13 (e). f, Detection of Trichuris antigen-specific IgG1 and IgG2c in serum from naïve Aregfl (n=4 mice) and Trichuris-infected Aregfl (n=12 mice) and AregΔILC2 (n=13 mice) at day 19 post-infection by serial dilution ELISA. Data in c and e are pooled from two independent experiments. Data in f are pooled from three independent experiments. One-way ANOVA with Tukey multiple comparisons test (c, e). Two-way ANOVA with Šídák multiple comparisons test (f). ns, not significant. Data are represented as means ± S.E.M.
