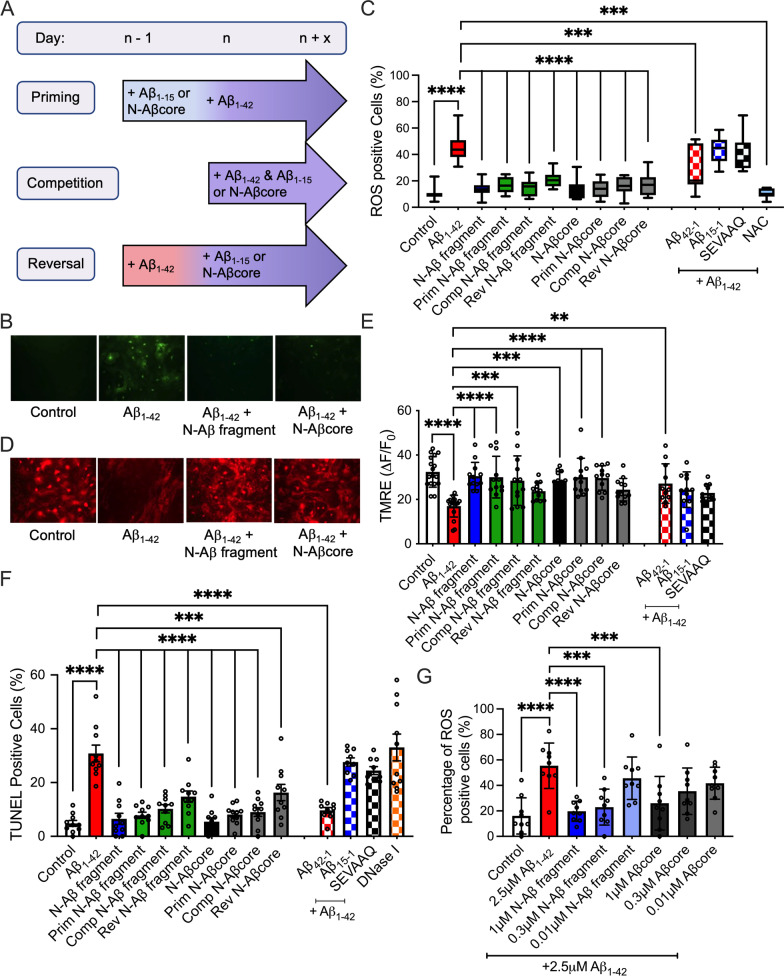
Fig. 6.
The N-Aβ fragment and N-Aβcore mitigate cellular toxicity induced by Aβ1–42 in primary cortical astrocytes and microglia. Primary cortical astrocytes and microglia in mixed glial cultures were treated daily with media only (Control), 2.5 μM Aβ1–42, 2.5 μM N-Aβ fragment, 2.5 μM N-Aβcore, 2.5 μM Aβ1–42 + 1 μM N-Aβ fragment or 2.5 μM Aβ1–42 + 1 μM N-Aβcore prior to analysis of cellular toxicity. A Treatment schematic depicting priming, competition and reversal conditions. N-Aβ fragment: Aβ1-15. B Representative images of reactive oxygen species (ROS) staining after daily treatment for two days with media only (Control), 2.5 μM Aβ1–42, 2.5 μM Aβ1–42 + 1 μM N-Aβ fragment or 2.5 μM Aβ1–42 + 1 μM N-Aβcore. C Percentage of ROS-positive glial cells under priming, competition and reversal conditions (n = 3 cultures). D Representative images of TMRE staining after daily treatment for three days with media only (Control), 2.5 μM Aβ1–42, 2.5 μM Aβ1–42 + 1 μM N-Aβ fragment or 2.5 μM Aβ1–42 + 1 μM N-Aβcore. E Mitochondrial membrane potential disruption was quantified by the integrated values (ΔF/F) for TMRE staining in individual glial cells after treatment under priming, competition and reversal conditions. F Percentage of TUNEL-positive astrocytes and microglia after treatment under priming, competition and reversal conditions. Quantification of oxidative stress, mitochondrial dysfunction and apoptosis as the percent of mean cell counts per experimental n (total number of independent experiments). G Percentage of ROS-positive glial cells after treatment with media only (Control), 2.5 μM Aβ1–42 and 2.5 μM Aβ1–42 + 1, 0.3 or 0.01 μM N-Aβ fragment or N-Aβcore (n = 3 cultures). Data are represented as a box-and-whisker plots across 5–95 percentile range, with the lines indicating median values or means ± SD. (All data analyzed via one-way ANOVA with Dunnett post hoc test as compared to 2.5 μM Aβ1–42.) **p < 0.01; ***p < 0.001; ****p < 0.0001. All images in B and D were obtained on an Olympus IX71 fluorescent microscope via a 40× objective. 2.5 μM Aβ42-1, 2.5 μM Aβ1–42 + 1 μM Aβ15-1 and 2.5 μM Aβ1–42 + 1 μM SEVAAQ (inactive substituted N-Aβcore) as additional control conditions. Prim priming condition, Comp competition condition, Rev reversal condition, NAC N-acetylcysteine, ns non-significant

