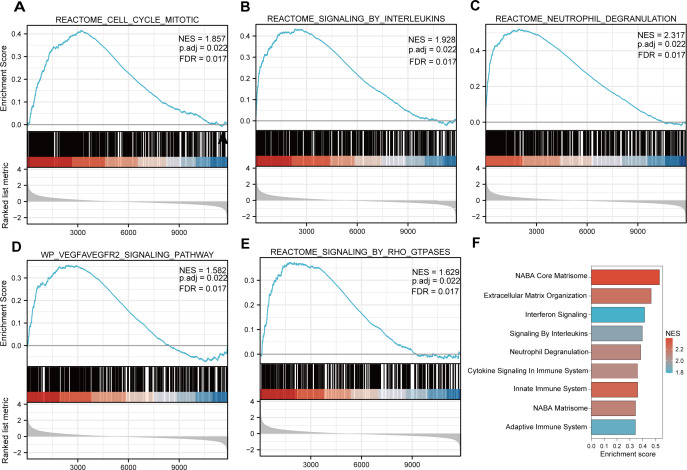
Figure 3. GSEA plots present most enriched gene sets between the control and DN groups.
The C2 sub-collection CP gene collection was applied to conduct the canonical pathway enrichment analysis of the expression profile as a whole. (A–E) The top five most significant enriched gene sets are shown. (F) The bar plot shows the top enriched gene pathways. NES, normalized enrichment score; FDR, false discovery rates or adjusted p-value; ES, enrichment score.

