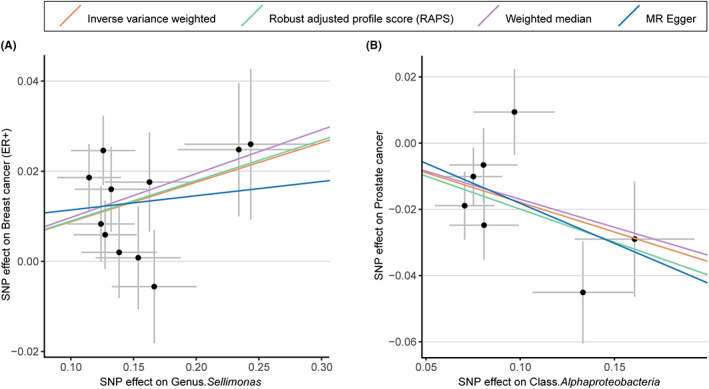
FIGURE 3.

Scatterplot of two significant associations of two gut microbiota with ER+ breast cancer and prostate cancer. Scatterplot of genetic effects on genus Sellimonas versus the effects on ER+ breast cancer (A) and genetic effects of class Alphaproteobacteria versus the effects on prostate cancer (B), with corresponding standard errors denoted by horizontal and vertical lines. The slope of each line corresponds to the estimated effect from different models. ER+, estrogen receptor‐positive; SNP, single nucleotide polymorphism.
