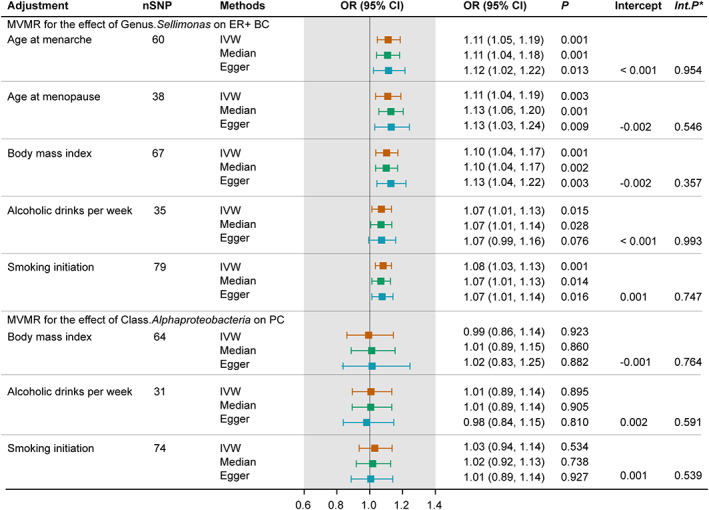
FIGURE 4.

Forest plot for the MVMR accounting for common risk factors of breast and prostate cancer. *Int.p refers to the p values derived from Egger intercepts. CI, confidence interval; ER+ BC, estrogen receptor‐positive breast cancer; IVW, inverse variance weighted; OR, odds ratio; PC, prostate cancer; SNP, single nucleotide polymorphism.
