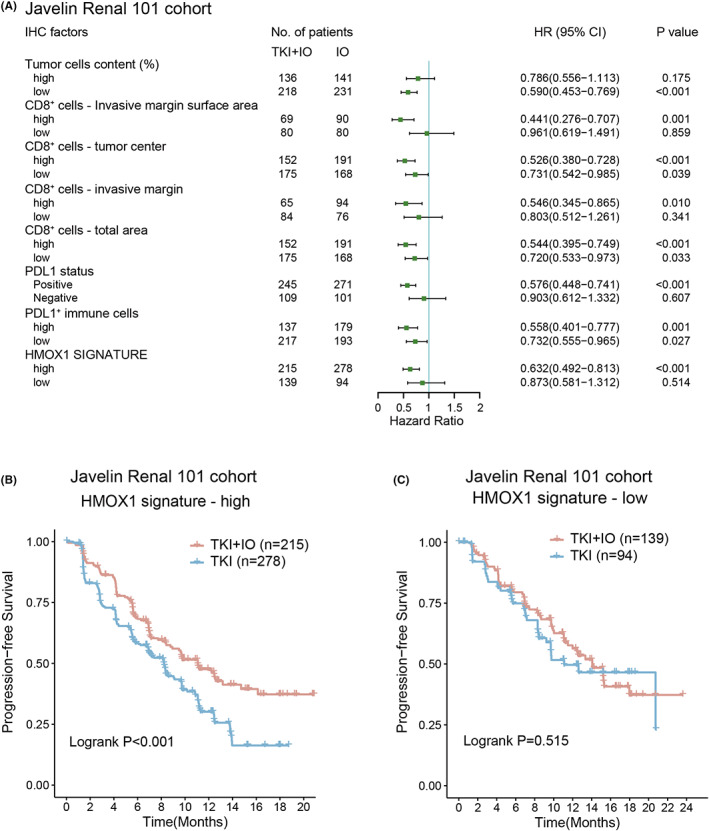
FIGURE 2.

HMOX1 signature associated with clinical benefit of TKI + IO compared with TKI. (A) Different clinical benefit of TKI + IO versus TKI monotherapy for PFS in subgroups defined by IHC markers and expression of HMOX1 pathway signature. HR and p values, Cox regression model; (B, C) PFS of TKI + IO or TKI monotherapy in different HMOX1 pathway signature expression subgroups. (B) With high HMOX1 pathway signature, (C) with low HMOX1 pathway signature. p value, Kaplan–Meier analysis, and log‐rank test.
