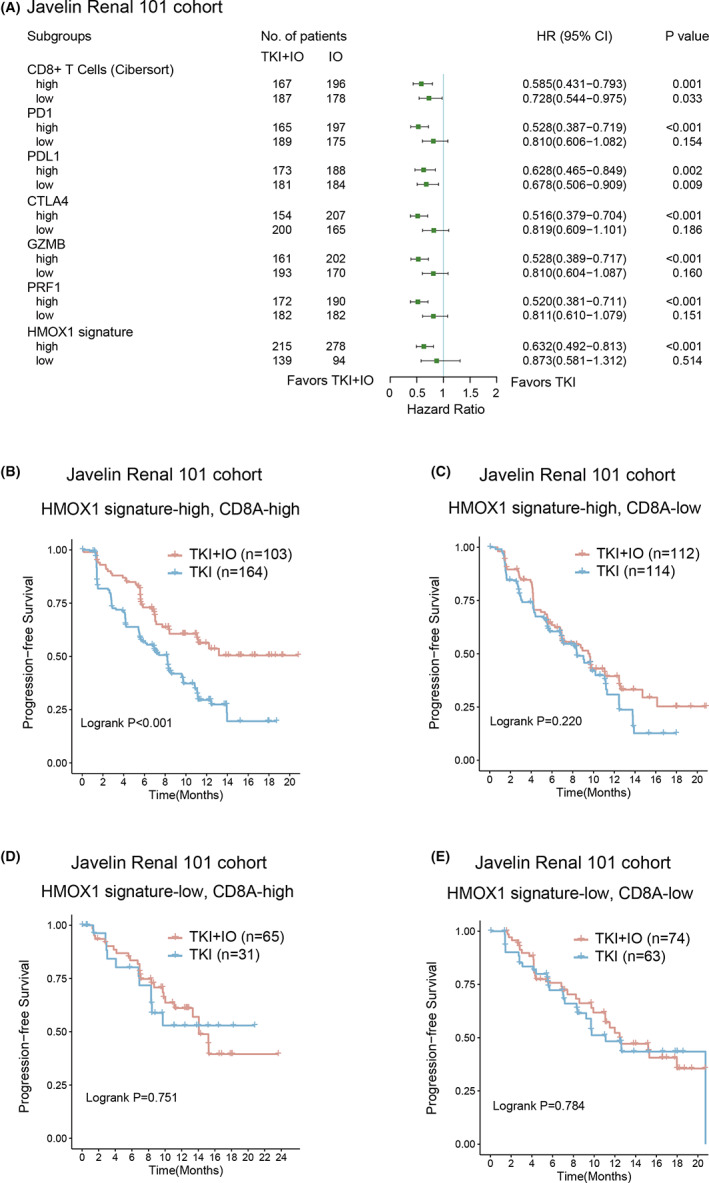
FIGURE 3.

Interaction between HMOX1 signature and CD8+ T cells for TKI + IO benefit stractification. (A) Different clinical benefit of TKI + IO versus TKI monotherapy for PFS in subgroups defined by TME components and expression of HMOX1 pathway signature. HR and p values, Cox regression model; (B–E) PFS of TKI + IO in different HMOX1 signature expression and CD8+ T‐cell subgroups. (B) With high HMOX1 signature and high CD8A, (C) with high HMOX1 signature and low CD8A, (D) with low HMOX1 pathway and high CD8A, (E) with low HMOX1 signature and low CD8A. p value, Kaplan–Meier analysis, and log‐rank test.
