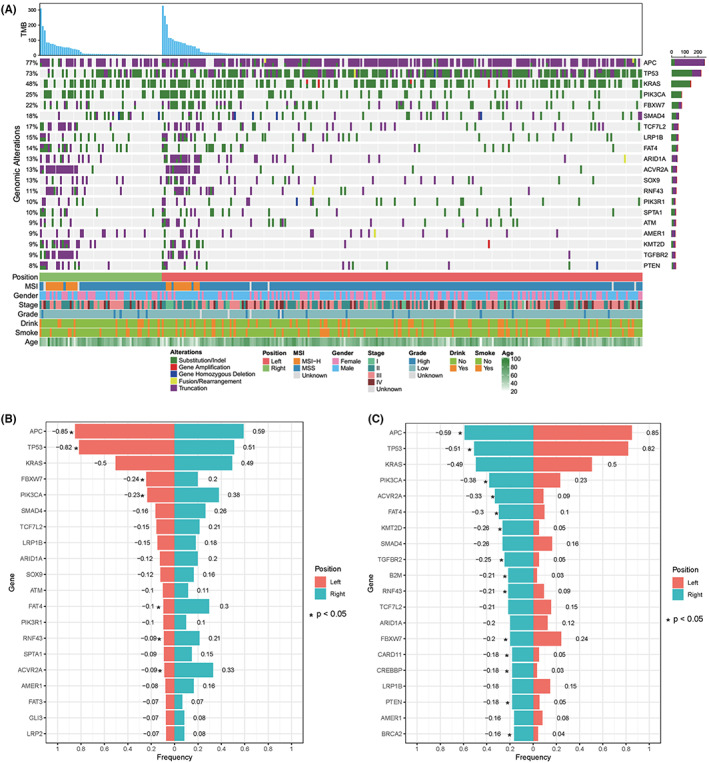
FIGURE 1.

(A) The genomic variations of 301 CRCs. The panel shows the matrix of mutations colored by mutation type. The first row provides TMB values. Each column denotes an individual tumor and each row represents a gene. The right panel provides the gene name of the mutations and the left panel provides the proportion of mutations. Green: Substitution/Indel; Red: Gene amplification; Blue: Gene homozygous deletion; Yellow: Fusion/Rearrangement; Purple: Truncation. (B‐C) Genes with a significant difference in mutation frequency between left‐ and right‐sided CRC.
